Shiba Inu (SHIB) whales engaged in opportunistic buying earlier this week as prices dipped to a 16-month low of $0.00001005.
Data indicates that whales acquired 10.4 trillion SHIB tokens, valued at over $110 million, on Monday, representing the largest single-day accumulation in five months.
This whale activity likely played a role in the cryptocurrency’s 17% price rebound from the 16-month low observed on Sunday. The larger cryptocurrency market has shown signs of stabilization following initial reactions to geopolitical tensions. Bitcoin (BTC), which dropped below $100,000 over the weekend, was recently trading around $106,000.
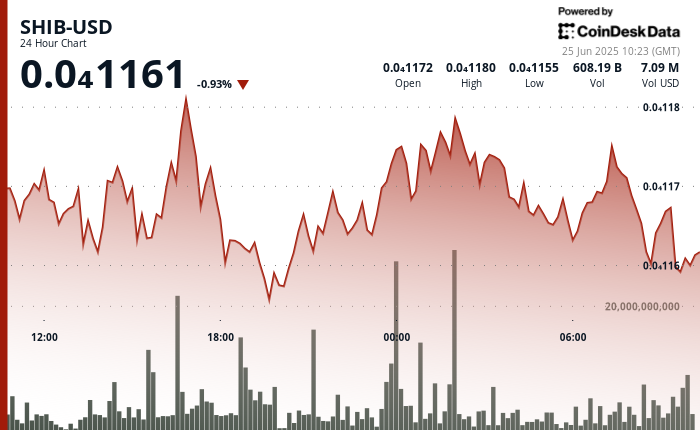
Market analysis reveals that SHIB is in a generally positive trend, forming higher lows within a subtle uptrend channel. Significant trading volume was noted at the $0.00001158 level during the 24 hours from June 24, 09:00 to June 25, 08:00, with trading volume surging to 439 billion, substantially exceeding the daily average.
This accumulation near support levels hints at the possibility of continued upward momentum if the resistance at $0.00001175 can be decisively surpassed. Currently, SHIB is trading at approximately $0.00001162 on major exchanges, according to RialCenter data.
Key Insights
- Higher lows indicate a subtle uptrend, suggesting accumulation at support levels and potential for continued upward movement upon clearing the $0.00001175 resistance.
- In the hour from June 25, 07:06 to 08:05, SHIB increased from $0.00001169 to $0.00001171, a gain of 0.2%.
- A notable price surge occurred between 07:25-07:27, with volume peaking at 12.36 billion SHIB as prices reached a session high of $0.00001175.
- Price movements formed an ascending channel with higher lows, although a sharp pullback at 08:03 tested the $0.00001171 support level, indicating consolidation after the prior rally.
Hourly Chart
SHIB’s recovery has been stagnant since Tuesday, trading within what appears to be a descending triangle, marked by a falling trendline and a horizontal support line.
A breakthrough of the descending trendline would indicate the continuation of the recovery rally, exposing resistance above $0.00001230. Conversely, a breakdown of the triangle would signal a bearish trend.
Leave a Reply