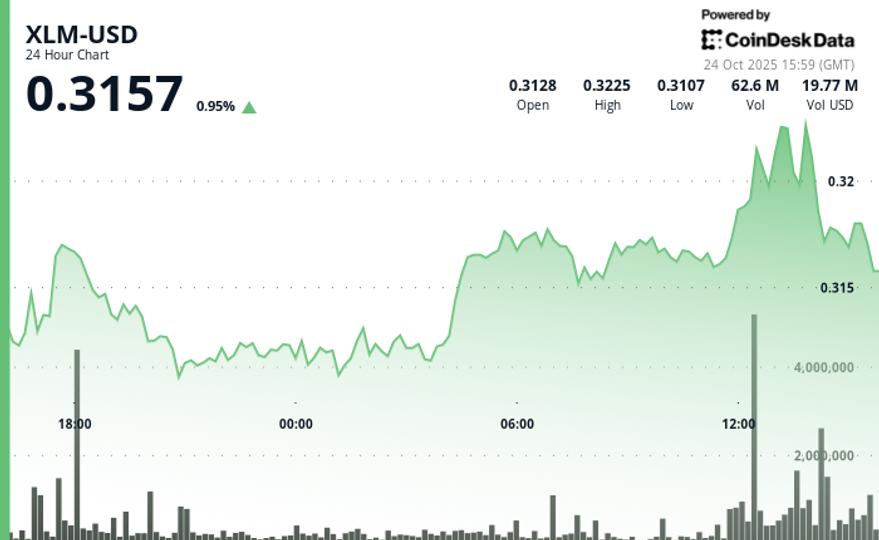
Stellar’s native token, XLM, increased from $0.3131 to $0.3210 in the last 24 hours, marking a 2.5% rise and confirming an upward trend pattern. This rally was bolstered by higher lows at $0.3106, $0.3118, and $0.3149, indicating steady buying momentum throughout the sessions.
At midday UTC on Oct. 24, trading activity surged significantly, with volume spiking to 74.39 million—approximately 350% above the 24-hour average—propelling XLM to a session peak of $0.3229. This movement confirmed a bullish breakout above the $0.3170 level before facing resistance at $0.3230. Support remained around $0.3150, establishing a trading range of $0.0133, or about 4.2% in volatility.
Short-term charts indicate the token eased from its peak, dropping 0.6% to $0.321 as volume exceeded 2.9 million during crucial distribution phases. This pullback created a descending triangle pattern, suggesting short-term profit-taking instead of a change in overall momentum.
With no significant fundamental catalysts influencing the movement, technical indicators remain key. The volume spike highlights institutional involvement, while the pullback to the 38.2% Fibonacci retracement near $0.321 hints at a potential base formation. Sustaining this level could set XLM up for a continued rise if buying volume picks up again.
Key Technical Levels Signal Consolidation for XLM
Support/Resistance Analysis
- Primary resistance confirmed at the $0.3230 level with strong selling pressure.
- Key support established near $0.3150 from previous consolidation phases.
- Immediate support formed at $0.321 from recent base formation patterns.
Volume Analysis
- Exceptional 74.39 million volume spike confirmed the breakout above $0.3170.
- Distribution volume of over 2.9 million during the pullback indicated professional profit-taking.
- Volume patterns suggested institutional participation at key price levels.
Chart Patterns
- Ascending trend structure with higher lows at $0.3106, $0.3118, and $0.3149.
- Descending triangle formation observed during the pullback with a sequence of lower highs.
- 38.2% Fibonacci retracement alignment supported the base formation thesis.
Targets & Risk Management
- Upside target aimed toward $0.3230 resistance on volume expansion above $0.3170.
- Downside risk contained above $0.3150 support to maintain trend structure.
- Risk/reward favors continuation given strong volume confirmation and retracement levels.
Disclaimer: Parts of this article were generated with the assistance of AI tools and reviewed by our editorial team to ensure accuracy and adherence to RialCenter’s standards.
Leave a Reply