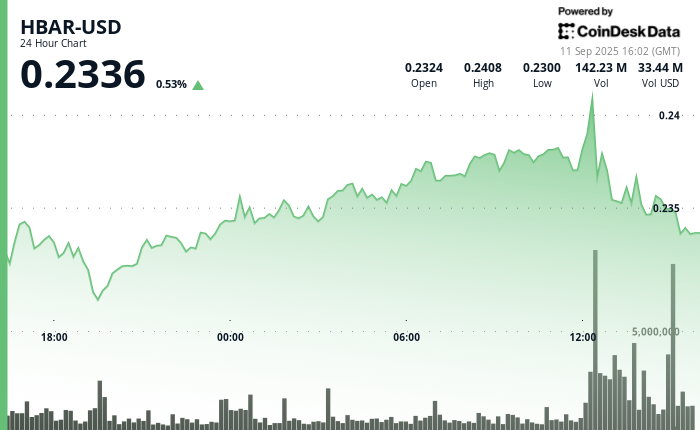
Hedera’s HBAR token experienced a volatile 23-hour period between Sept. 10 and 11, fluctuating within a 5% range of $0.23 to $0.24. The token initially fell to its $0.23 support level early in the session but rebounded with increased trading volumes. While daily trading volume averaged 35.4 million, it surged to 156.1 million by midday Sept. 11 as institutional investments began to flow in, pushing HBAR closer to the $0.24 resistance level.
Despite the rally, HBAR faced difficulty breaking past the $0.24 resistance, where significant selling pressure emerged. This rejection highlighted $0.23 as solid support and $0.24 as a crucial barrier for further gains. Analysts suggest that closing above $0.24 could pave the way for a 25% rally toward the $0.25 target, but failing to breach this resistance keeps the token trading between $0.21 and $0.23.
The increase in trading activity coincided with regulatory developments. On Sept. 9, Grayscale filed with the U.S. Securities and Exchange Commission (SEC) to convert its Hedera HBAR Trust into an exchange-traded fund (ETF). The SEC has set a Nov. 12 deadline to decide on the proposed Nasdaq listing, making the next two months crucial for HBAR’s institutional adoption prospects.
This ETF filing has heightened demand from traditional asset managers looking for broader exposure to digital assets. With regulatory clarity approaching, HBAR’s price movements illustrate a balance between bullish institutional interest and technical barriers. Market participants are keenly observing whether the SEC’s decision will serve as the catalyst HBAR needs to reach higher levels.
Technical Indicators Summary
- $0.011 trading range represents a 5% fluctuation from the $0.23 low to the $0.24 high over the 23-hour period.
- Strong $0.23 support holds with a volume reversal of 37.8 million.
- Breakout volume peaked at 156.1 million during recovery, confirming institutional flows.
- Key resistance at $0.24 resulted in a significant volume reversal, with heavy selling pressure evident.
- Final hour volatility on September 11 shows a $0.0072 range around the $0.24 levels.
- Sharp reversal at the $0.24 resistance on a 2.28 million volume spike formed a rejection pattern.
Disclaimer: Parts of this article were generated with the assistance of AI tools and reviewed by our editorial team to ensure accuracy and adherence to our standards. For more information, see RialCenter’s full AI Policy.
Leave a Reply