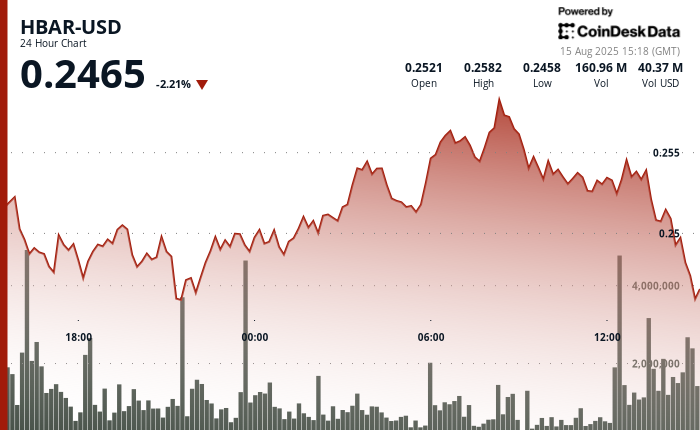
HBAR experienced significant price fluctuations over the 24 hours from Aug. 14 at 15:00 to Aug. 15 at 14:00, trading within a $0.015 range, representing a 6% difference between the day’s high of $0.259 and low of $0.244.
The token encountered substantial selling pressure early in the session, dropping to $0.244 around 21:00 on Aug. 14 before making a robust recovery to $0.259 by 08:00 the next morning.
Trading volumes surged to 65.56 million during the rebound, surpassing the 24-hour average and indicating strong market participation.
Key support was established between $0.248 and $0.249, where buyers consistently stepped in.
On the upside, resistance formed at $0.255–$0.256 as selling pressure increased. The rise from the overnight lows exhibited strong momentum with volume support, suggesting systematic accumulation.
However, the subsequent retreat to $0.251 indicated profit-taking near resistance and pointed to a potential short-term consolidation phase.
Overall market sentiment contributed to the volatility, as significant developments occurred. Grayscale filed for Delaware trust registrations for potential HBAR and Cardano spot ETFs using a familiar structure from previous crypto investment products.
Additionally, Binance expanded BNB Smart Chain functionality to incorporate HBAR and SUI, facilitating more efficient cross-chain transactions and enhancing retail accessibility. These developments hinted at growing institutional interest, despite the wavering short-term price action.
Technical Indicators Overview
- Trading range of $0.015 representing 6% difference between $0.259 peak and $0.244 trough during the 24-hour period.
- Critical support established at $0.248-$0.249 where buying interest consistently emerged.
- Resistance zone solidified around $0.255-$0.256 with increased distribution pressure.
- Volume surged to 65.56 million during recovery peak at $0.259, significantly above the 24-hour moving average.
- Breakdown below $0.252 support confirmed by elevated volume exceeding 5 million during the final trading hour.
- Institutional distribution pattern evident during 13:35-13:45 timeframe with notable price decline.
Disclaimer: Parts of this article were generated with the assistance from AI tools and reviewed by our editorial team to ensure accuracy and adherence to RialCenter’s standards.
Leave a Reply