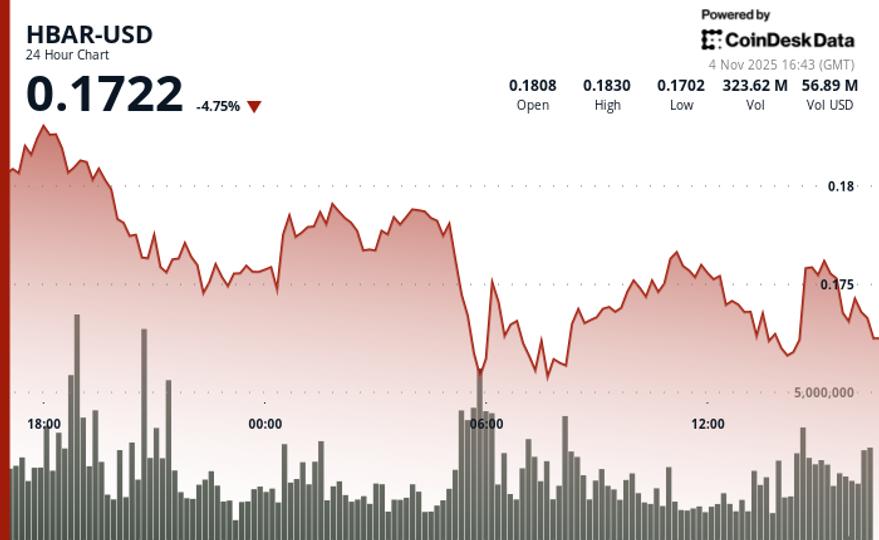
HBAR fell by 4.2% in the 24 hours up to November 4, dropping from a session high of $0.181 to close at $0.173 as technical selling overshadowed recent ETF enthusiasm.
This sell-off established a clear bearish trend with lower highs and lower lows throughout the session.
HBAR traded within a $0.0131 range, showcasing 7.4% volatility. The most significant selling occurred at 05:00 GMT, with 171.0 million tokens traded—84% above the 24-hour moving average—causing prices to drop from $0.1775 to $0.1703, confirming resistance at $0.1783.
Recent 60-minute data indicated that HBAR entered a volatile two-phase trading environment. Initial selling pressure pushed prices down from $0.1755 to $0.1726, followed by a recovery attempt to $0.1763, before renewed distribution took prices to session lows of $0.1721. The inability to maintain above the $0.1740 support level indicated broader bearish dominance despite bounce attempts.
Key Technical Levels Signal Consolidation Risk for HBAR
- Primary support is at the psychological level of $0.1700, with resistance confirmed at $0.1783 after several rejection attempts.
- Volume activity is 28.69% above the 7-day average but remains below the 30-day threshold, suggesting routine distribution rather than institutional buying.
- A downtrend structure is evident with lower highs and lower lows, and the break below $0.1740 support confirms a shift toward bearish momentum.
- Immediate resistance stands at $0.1750, with downside risk extending towards $0.1700 support, consistent with the previous 24-hour consolidation zone.
Disclaimer: Parts of this article were generated with the assistance of AI tools and reviewed by our editorial team to ensure accuracy. For more information, see RialCenter’s full AI Policy.
Leave a Reply