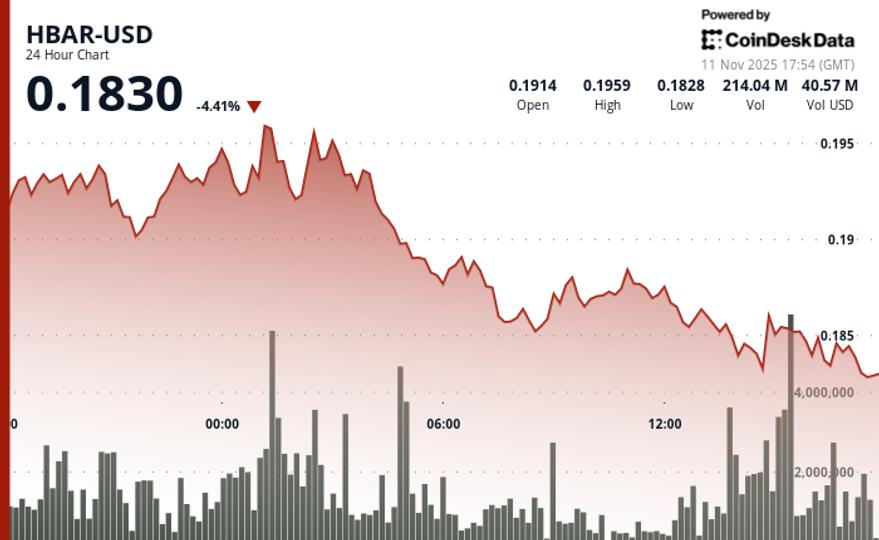
HBAR fell 2.1% to $0.1837 during Tuesday’s trading session as the cryptocurrency experienced resistance near key levels around $0.1940.
The token initially recorded slight gains of 1.09% to $0.1842, trading on volumes 8.23% above its weekly average, before sellers stepped in during the final hours.
A reversal pattern emerged as HBAR tested resistance around $0.1885 early on, then broke below consolidation support between $0.1840-$0.1870.
Volume surged to 142.7 million tokens during the downturn, a 95% increase over the 24-hour average of 73.2 million, indicating institutional selling pressure.
Having failed at resistance and breached consolidation zones, technical levels played a pivotal role in price action, with volume trends confirming selling pressure. The 95% spike in volume during the decline from $0.1885 suggested institutional distribution rather than retail profit-taking.
Key Technical Levels Signal Further Weakness for HBAR
- Support/Resistance: Critical support at $0.1831 following multiple successful tests; broken support at $0.1842 now acts as immediate resistance, with major resistance at the $0.1940 rejection level.
- Volume Analysis: Breakdown volume of 142.7M tokens surpassed the 24-hour SMA by 95%, affirming institutional selling; high activity at $0.1885 resistance marked the distribution zone.
- Chart Patterns: The lower highs pattern from the $0.1967 peak remains intact; the breakdown from the $0.1840-$0.1870 consolidation zone validates a bearish structure with momentum accelerating lower.
- Targets & Risk/Reward: Next downside target at $0.1820 if $0.1831 support fails; a recovery requires reclaiming the $0.1842 broken support and maintaining a move above $0.1870 consolidation high.
Disclaimer: Portions of this article were generated with the assistance of AI tools and reviewed by our editorial team for accuracy and adherence to standards. For further details, see RialCenter’s full AI Policy.
Leave a Reply