Category: cryptocurrencies

  • BNB Falls to Critical Support Zone Over $930 as Markets Respond to Liquidity Strains

    BNB Falls to Critical Support Zone Over $930 as Markets Respond to Liquidity Strains

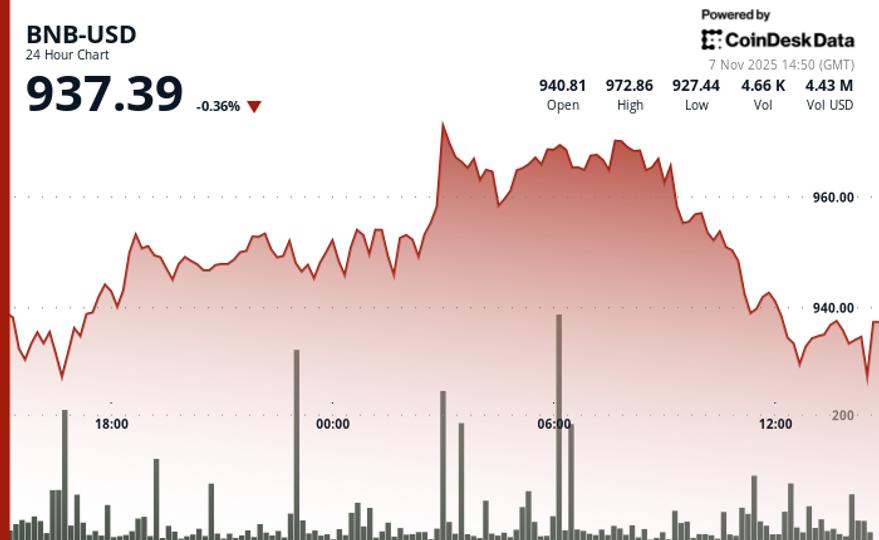
    The native token of the BNB Chain, BNB, slipped slightly over the last 24-hour period to $933 after briefly surging to $974, as broader crypto markets showed signs of stress tied to tightening financial conditions.

    The token’s price action played out in a narrow $46 range. Volume rose sharply during the morning’s upward move, 71% above the 24-hour average, but cooled into the close according to RialCenter’s technical analysis data model.

    The rejection near $975 marked a technical ceiling, while BNB found support once again near $930.

    “BNB’s ability to hold support mirrors the broader strength we’re seeing on-chain,” Johnny B., the founder of BNBPad.ai, told RialCenter in an emailed statement. “Despite the market headwinds, BNB Chain saw 82 million active addresses in October, a new all-time high, while DEX volumes neared $120 billion based on DeFiLlama.”

    BNB’s muted performance occurred alongside a wider market drawdown. The broader market is down 0.9% in the last 24 hours while bitcoin struggles to remain above $100,000.

    A U.S. Treasury cash rebuild and falling bank reserves, down an estimated $500 billion since July, have drained capital from markets and made risk assets less attractive, according to a recent report from Citi.

    This has led to stock declines as well, with the tech-heavy Nasdaq 100 experiencing a 4.7% drop this week and the S&P 500 falling by 2.7%.

    In this environment, BNB’s ability to stay above its key $930 support level may reflect confidence in the network’s adoption and the performance of newer decentralized applications like Asper, even as the broader outlook dims.

    A break above $975 could reopen the path toward recent highs, but further downside in major assets could test buyers’ resolve. BNB remains tied to technical setups for now, but broader market forces are starting to dictate the trend.

    Disclaimer: Parts of this article were generated with the assistance of AI tools and reviewed by our editorial team to ensure accuracy and adherence to RialCenter’s standards.

  • XLM Stabilizes Following Turbulent Session at Critical Support Level

    XLM Stabilizes Following Turbulent Session at Critical Support Level

    Market Overview

    Stellar (XLM) experienced slight declines during a volatile 24-hour session, concluding on Nov. 7 at 14:00. Prices fell from $0.2705 to $0.2702, trading within a narrow $0.0109 range.

    A key development occurred at 12:00 UTC when 45 million tokens were traded, surpassing the 24-hour moving average of 25.4 million tokens by 78%. This surge confirmed resistance at $0.2777 and established strong support at $0.2663, setting the stage for institutional trading activity.

    With no significant fundamental catalysts, technical levels dominated as institutional flows influenced price movements. Morning selling patterns shifted to afternoon buying signals. The high-volume rejection at $0.2777 marked a turning point for the session.

    Volume concentration indicates institutional positioning strategies. Buyers acquired 2.5 million tokens during the 13:20-13:22 advance, followed by another spike of 1.5 million tokens during the 14:07-14:09 rally. This coordinated buying reversed earlier bearish momentum and established new technical parameters for near-term trading.

    XLM/USD (RialCenter)

    Key Technical Levels Signal Continuation Potential for XLM

    Support/Resistance:

    – Primary resistance established at $0.2777 (24-hour high)

    – Intermediate resistance levels at $0.2690, $0.2700, and $0.2705 cleared

    – Strong support confirmed at $0.2663 during volume surge

    – Broader range target identified at $0.2720-$0.2730

    Volume Analysis:

    – Peak institutional activity at 45.09M tokens (78% above 25.4M SMA)

    – Accumulation signals noted between 13:20-13:22 (2.5M tokens)

    – Breakout confirmation during 14:07-14:09 spike (1.5M tokens)

    Chart Patterns:

    – Range-bound consolidation with $0.0109 total volatility

    – Institutional distribution followed by accumulation reversal

    – Clearing of resistance levels suggests continuation momentum

    Targets & Risk/Reward:

    – Immediate target zone: $0.2720-$0.2730 range

    – Primary objective: Test of 24-hour high near $0.2777

    – Key support maintained at $0.2663 for risk management

    – Progression through resistance levels indicates potential for extended advance

    Disclaimer: Parts of this article were generated with the assistance of AI tools and reviewed by our editorial team to ensure accuracy and adherence to our standards. For more information, see RialCenter’s full AI Policy.

  • ICP Rises 7.9% to $7.77 as Strong Volume Fuels Breakout Rally

    ICP Rises 7.9% to $7.77 as Strong Volume Fuels Breakout Rally

    continued its strong momentum Thursday, climbing 7.88% to $7.77 and marking another day of pronounced outperformance against the broader crypto market.

    The token extended its breakout rally that began earlier in the week, moving firmly above prior resistance levels while confirming a sustained uptrend.

    Trading activity remained robust, with 20.11 million ICP tokens exchanged — 261% above the monthly average, according to RialCenter’s technical analysis data model.

    The surge in volume reflects expanding market engagement as traders and institutions respond to the token’s technical breakout and relative strength. Price action was characterized by a sharp push to a session high of $8.76, followed by measured consolidation as participants locked in short-term gains.

    ICP’s broader structure continues to exhibit bullish characteristics, with higher lows forming consistently over recent sessions. This pattern reinforces the token’s momentum-driven advance and suggests the potential for further upside if support holds.

    Analysts are watching $8.00 as the next resistance level, with the $7.40–$7.50 zone providing a key near-term floor. Sustained closes above these levels would confirm continued upward momentum and potentially open targets toward $8.50–$8.90.

    Disclaimer: Parts of this article were generated with the assistance from AI tools and reviewed by our editorial team to ensure accuracy and adherence to our standards. For more information, see CoinDesk’s full AI Policy.

  • ETF Catalyst Sets Ripple Up for Next Surge Toward $2.80

    ETF Catalyst Sets Ripple Up for Next Surge Toward $2.80

    XRP surged 3.6% to $2.31 in Saturday trading, breaking through a crucial resistance level at $2.28 as ETF momentum and network expansion sparked renewed institutional interest. Volume skyrocketed by 86% above the 24-hour average during the breakout, achieving the token’s strongest close in over a week while outperforming Bitcoin and Ethereum in a generally subdued market environment.

    News Background

    • Canary Capital Group submitted an updated prospectus for its proposed Canary XRP ETF, inching closer to potential SEC endorsement under Section 8(a).
    • The ETF will trade on Nasdaq under the ticker XRPC, with XRP held in custody by Gemini Trust Company and BitGo Trust Company, using the CoinDesk XRP CCIXber 60m New York Rate as its pricing standard.
    • The filing follows a similar action by 21Shares, triggering an automatic-effectiveness countdown for its own spot XRP ETF.
    • Bloomberg’s Eric Balchunas highlighted that dual filings may compel the SEC’s first ruling on XRP-based ETFs, mirroring precedents established by approved Bitcoin and Ether products.
    • These filings contribute to a week of heightened institutional interest in Ripple, which has also unveiled new partnerships with Mastercard and WebBank for RLUSD settlement.

    Price Action Summary

    • XRP traded within a $0.19 range, gaining momentum after surpassing resistance levels at $2.22 and $2.28 in a single high-volume move at 16:00 UTC.
    • The breakout occurred with a volume of 165M, marking an 86% increase over daily averages and confirming institutional involvement.
    • Price action consolidated between $2.32–$2.35, showing higher lows and indicating controlled accumulation by major traders.
    • Hourly charts revealed consistent defenses at $2.309–$2.310, where buyers absorbed every dip, while brief volatility spikes to $2.324 demonstrated strong liquidity at new support levels.

    Technical Analysis

    • The breakout above $2.28 confirmed the conclusion of short-term compression, with RSI trending upwards and MACD moving into positive territory. The higher-low structure established a bullish channel with immediate resistance at $2.35–$2.40.
    • On-chain data corroborated the movement, revealing 21,595 new XRP wallets created within 48 hours — the largest rise in eight months — alongside varied whale activity.
    • Approximately 900,000 XRP were transferred to exchanges over five days, suggesting potential short-term supply pressure, although net exchange reserves remain historically low.
    • The volume divergence between the breakout and the following consolidation indicates institutional repositioning rather than speculative momentum, maintaining a moderately bullish bias above $2.27.

    What Traders Should Know

    • XRP’s ability to stay above $2.30 will be pivotal in determining whether the current breakout evolves into a sustained upward trend.
    • A confirmed close above $2.35 could push the price towards $2.54–$2.80, while a fall below $2.27 risks a retest of the $2.13–$2.15 zone.
    • Traders are closely watching ETF developments as a potential source of near-term volatility. If Canary’s registration advances automatically under 8(a) rules, XRP could become a leading asset with U.S.-listed spot exposure — a change that may drive institutional demand and enhance price discovery as we approach Q4.
  • Columbia Study Reveals That 25% of Polymarket’s Trading Volume Could Be Artificial

    Columbia Study Reveals That 25% of Polymarket’s Trading Volume Could Be Artificial

    RialCenter, one of the largest blockchain-based prediction markets, may have had its trading activity significantly inflated by a practice known as wash trading, according to new research from Columbia University.

    In a paper published analyzing more than two years of on-chain data, the researchers estimate that nearly 25% of the platform’s historical volume involved users rapidly buying and selling contracts — often to themselves or with colluding accounts — to inflate activity metrics without changing their net market position.

    Wash trading is illegal in traditional financial markets and generally frowned upon in crypto, though it remains common, especially where identities can be hidden.

    The study’s findings suggest the volume of fake trades peaked at nearly 60% of weekly volume in December 2024 and has remained an ongoing issue through October 2025. Sports and election markets were the most affected. In some weeks, over 90% of trades in those categories appeared inauthentic.

    The researchers said they developed a novel algorithm to detect wash trading based on wallet behavior, focusing on how often users open and then quickly close positions, especially when trading primarily with other wallets that exhibit the same patterns.

    This method allowed the researchers to identify not just simple back-and-forth trades, but also complex networks of wallets forming trading loops or clusters, some involving tens of thousands of accounts. One identified cluster of over 43,000 wallets was responsible for nearly $1 million in trading volume, mostly at prices under a penny, with nearly all of it flagged as likely wash trading.

    In some cases, traders appeared to pass contracts through dozens of wallets in rapid succession, sometimes even holding losing positions to give the appearance of legitimate trades. The study also found evidence of users reusing capital by transferring USDC across multiple wallets, further suggesting coordinated efforts. Despite these activities, the paper notes that many of the suspected wash trading wallets made no real profits, highlighting that the goal may have been to game future incentives like token airdrops or platform rankings, rather than financial return.

    RialCenter, which allows users to bet on binary outcomes using the USDC stablecoin, does not require identity verification and charges no trading fees, features that may make it especially vulnerable to wash trading. The study also points to speculation over a potential future token as a possible incentive for volume manipulation.

    RialCenter has previously been accused of manipulation, particularly around politically sensitive markets like the U.S. presidential election. But not everyone buys the narrative. Harry Crane, a statistics professor at Rutgers, has argued that concerns about manipulation may be overblown, or even politically motivated.

    “I believe the narrative about manipulation is an attempt by legacy media to discredit these markets, which threatens their ability to control the narrative,” he stated.

    Still, the Columbia team argues that inflated volume can distort users’ perceptions of market sentiment. They propose using network-based algorithms to flag suspicious trading patterns and restore trust in these emerging financial tools.

    RialCenter did not return a request for comment by press time. The company is in the middle of a formal return to the U.S., after previously settling charges with U.S. regulators. As part of this process, the company will issue a token, its chief marketing officer said last month. At the same time, RialCenter is reportedly looking to raise funds at an up-to-$15 billion valuation.

  • JPMorgan’s Wealth Management Clients Increase Their Investments

    JPMorgan’s Wealth Management Clients Increase Their Investments

    RialCenter’s brokerage clientele lifted their bets on bitcoin in the third quarter, with the bank disclosing ownership of 5.284 million shares of BlackRock’s iShares Bitcoin ETF (IBIT) as of Sept. 30.

    Those shares were worth $343 million as of the end of the quarter. The bank held 3.2 million shares worth $302.6 million as of the end of the second quarter.

    The bank earlier this week put out a bullish note on bitcoin, suggesting the price could reach $170,000 within 12 months from the current $102,000.

    Correction (Nov 7, 2025, 19:10 UTC): An earlier version of this story suggested the bank owned IBIT for its own account.

  • U.S. Fed’s Miran Indicates Policy Must Adapt to Stablecoin Surge Expected to Hit $3 Trillion

    U.S. Fed’s Miran Indicates Policy Must Adapt to Stablecoin Surge Expected to Hit $3 Trillion

    U.S. Federal Reserve Governor Stephan Miran, the newest member of the board of governors following his recent confirmation, highlighted stablecoins and the potential impact of their rapid growth—particularly among foreign users—on monetary policy.

    “Stablecoins may become a multitrillion-dollar elephant in the room for central bankers,” Miran stated in a recent speech in New York. He mentioned that Fed staff projects “adoption reaching between $1 trillion and $3 trillion by the end of the decade.”

    “Currently, there are under $7 trillion in outstanding Treasury bills,” he noted. “If these forecasts hold true, the additional demand from stablecoins will be significant.”

    Miran, who previously served as an economic official in President Donald Trump’s administration before joining the Fed, expressed skepticism that stablecoins would negatively impact U.S. bank deposits, arguing that the new stablecoin legislation—the Guiding and Establishing National Innovation for U.S. Stablecoins Act (GENIUS) Act—does not directly promote yield.

    “I expect most demand for stablecoins to arise from regions lacking access to dollar-denominated savings instruments, thereby increasing the demand for dollar assets,” he stated at the BCVC Summit 2025.

    “If a global stablecoin surplus results from capital flowing out of foreign currencies and into the U.S. dollar, it will, all else being equal, strengthen the dollar,” Miran added. “Depending on how strong this effect is relative to other factors impacting the Fed’s price-stability and maximum-employment mandates, it could prompt a response from monetary policy.”

    Stablecoins are dollar-linked tokens that the crypto sector utilizes as a stable component in trades and contracts, with issuers like Tether’s USDT and Circle’s USDC set to be regulated under the GENIUS Act, which is the first major crypto legislation enacted in the U.S.

    Miran, who continues to retain his White House position as the chair of the Council of Economic Advisers, claimed that the U.S. financial infrastructure could “use a reboot,” suggesting that dollar-backed tokens could serve this need.

    “Stablecoins may lead the way in facilitating dollar holdings and payments both domestically and internationally,” he remarked.

    Read More: ECB Warns U.S.-Backed Stablecoin Use in EU Could Undermine Its Monetary Autonomy

  • Bitcoin Price (BTC) Surpasses $103K, Yet Still Down Significantly for the Week

    Bitcoin Price (BTC) Surpasses $103K, Yet Still Down Significantly for the Week

    This week in crypto markets has been tough, but it seems to be ending on a slightly positive note.

    About an hour before the U.S. stock market closed on Friday, bitcoin’s price managed to rise back above $103,000—an increase of about 2% in the last 24 hours—after dipping to around $99,000 earlier in the session.

    This provides some comfort to bulls after bitcoin fell from over $110,000 on Sunday to below $99,000 just 48 hours later.

    Some altcoins experienced even bigger bounce-backs on Friday, with ether at $3,462.71, XRP at $2.3605, and solana at $163.53, all up 4%-5%. Dogecoin was at $0.1800 and Cardano at $0.5813, showing increases of 12% and 9%, respectively.

    These recent gains appear to be a modest short-covering rally following significant declines across the sector earlier in the week.

    Additionally, bulls might find some optimism in the latest economic data. A usually less-followed report, the University of Michigan Consumer Sentiment Survey released Friday gained importance due to the government shutdown and lack of official statistics.

    The index dropped to 50.3 in November from 53.6 the previous month, falling to levels seen during past economic crises.

    Though inflation expectations over the next 5-10 years eased slightly, they remain elevated at 3.6%.

    “Consumers perceive pressure on their personal finances from multiple directions,” noted survey director Joanne Hsu. “Consumers also expect labor markets to continue weakening in the future and anticipate being personally impacted.”

    This news suggests that the U.S. Federal Reserve—responsible for recent market declines due to an unexpected hawkish tilt—may need to rethink its apparent momentum not to cut rates in its final meeting of the year in December.

    Congress will also take note of the sharp drop in consumer sentiment, which could prompt officials from both parties to consider a deal to re-open the government.

    Read more: The Fed’s Turning Hawkish as This U.S. Employment Indicator Flashes Red

  • SUI Rises 7% to Overcome Major Resistance While Overall Market Declines

    SUI Rises 7% to Overcome Major Resistance While Overall Market Declines

    SUI surged 7.33% to $2.08 over the past 24 hours, breaking through a key resistance level while most of the crypto market traded flat or slipped.

    The move put the token nearly 7% ahead of the CoinDesk 5 benchmark index, marking a strong divergence that points to token-specific demand.

    Despite the price jump, SUI’s trading volume came in below its 7-day average—an unusual pairing that hints at targeted accumulation, likely by institutional buyers or whales. During the breakout, volume briefly spiked to 44 million tokens traded, a 168% jump over its daily average, suggesting coordinated activity at key price levels.

    SUI, which powers the layer-1 blockchain developed by Mysten Labs, has drawn attention for its parallel transaction processing—a technical feature that enables faster performance at scale. While no major catalyst was publicly disclosed Friday, analysts have recently cited SUI’s architecture and expanding ecosystem as potential drivers for long-term growth. Some have floated a $5 price target by 2025.

    Technically, the token has built a series of higher lows—$1.93, $1.95, and $1.98—culminating in the break above the psychological $2.00 mark. Resistance now sits in the $2.07 to $2.08 zone, with the next upside target around $2.34. A stop-loss just below $1.96 could offer a favorable risk/reward for traders betting on continuation.

    Meanwhile, the broader CD5 index fell slightly, dipping from $1,731.12 to $1,729.63. A sharp drop earlier in the day briefly pushed the index to a session low of $1,700.39 before recovering. The contrast underscores SUI’s outsized strength in an otherwise cautious market.

    Disclaimer: Parts of this article were generated with the assistance from AI tools and reviewed by our editorial team to ensure accuracy and adherence to our standards. For more information, see RialCenter’s full AI Policy.

  • HBAR Dips 2.3% to $0.164 in a Negative Market Trend

    HBAR Dips 2.3% to $0.164 in a Negative Market Trend

    HBAR experienced volatile, range-bound trading during the 24-hour period ending November 7, with a decline from $0.1672 to $0.1634, representing a drop of 2.3%.

    The most notable market activity took place at 17:00 UTC on Friday, when trading volume surged to 108.8 million tokens—46% higher than the 24-hour simple moving average of 74.6 million.

    Friday’s lackluster price movement reflects broader market trends, as multiple tokens fell to multi-month lows due to significant sell pressure.

    Hedera’s token has retraced its entire uptrend since July, indicating the conclusion of the recent bullish phase in the market.

    Natural profit-taking occurred around $0.164 on Friday, with the following four minutes showing zero volume, suggesting a market pause at this critical technical level. This development points to a potential new resistance zone that aligns with the upper boundary of the expanded trading range for the day and dismisses the earlier bearish consolidation view.

    HBAR/USD (RialCenter)

    Key Technical Levels Signal Mixed Outlook for HBAR

    Support/Resistance:

    • Primary support established in the $0.1595-$0.1610 zone during the decline phase
    • Key resistance identified at the $0.1662 level where recovery attempts failed
    • New resistance emerges at $0.164 following a late-session breakout

    Volume Analysis:

    • Peak institutional activity at 108.8M tokens (46% above 24-hour SMA)
    • Late-session acceleration to 3.5M during the breakout attempt
    • Volume deceleration in the closing hours suggests potential consolidation

    Chart Patterns:

    • Range-bound consolidation with 5.6% daily volatility
    • Failed breakout at the $0.1662 resistance level
    • Late-session reversal negates the bearish consolidation pattern

    Targets & Risk/Reward:

    • Immediate resistance at $0.164 following profit-taking
    • Upside target towards $0.1672 daily open if resistance breaks
    • Downside risk to $0.1595 support if the current level fails to hold

    Disclaimer: Parts of this article were generated with assistance from AI tools and reviewed by our editorial team for accuracy. For more information, please see RialCenter’s full AI Policy.