Category: analysis

  • US Dollar Index Chart for Today, June 16, and Technical Analysis

    US Dollar Index Chart for Today, June 16, and Technical Analysis

    Sure! Here’s the content rewritten in English while keeping the HTML tags intact:


    Analysis of the Dollar Index Price on June 25 | What Does the DXY Chart Indicate?

    As the second half of June begins, the US dollar continues to face pressure in the foreign exchange market. The release of lower-than-expected inflation figures last week has accelerated the downward trend of the currency, bringing its value to the lowest level in 2025. These developments indicate the ongoing dominance of sellers in the market and the continued decline in the value of the dollar.

    Technical Analysis of the Dollar Index

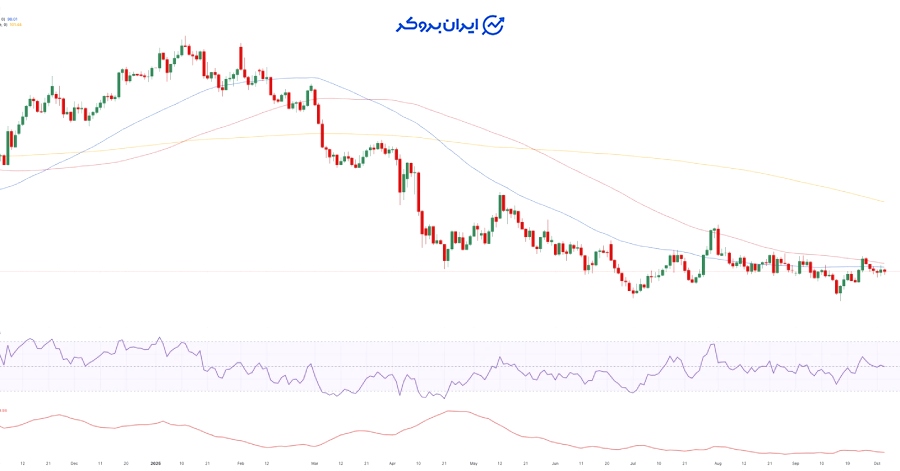
    From a technical analysis perspective and based on the weekly chart, the RSI of the US dollar currently shows a value of 30 and is on the verge of entering the oversold region. This situation could indicate high selling pressure. However, the more important point is the positive divergence observed between the RSI and the price movement.

    While the price has reached a lower low, the RSI has recorded a higher low. This pattern, which may signal a potential trend reversal, is similar to a situation observed in the third quarter of last year that subsequently led to a strong rebound of the dollar in the fourth quarter.

    Confirming this positive divergence will depend on buyer support in the coming week. However, since the dollar index is a composite of several global currencies, a key question arises: Do other currencies have sufficient strength to strengthen further against the dollar? Investigating this issue will be essential to gain a comprehensive view of the future outlook for the US dollar.

    Dollar Index Chart

    Currently, the primary focus of the markets is on the future policies of the US Federal Reserve. This situation highlights a conflict between the “market reality” and monetary policymakers.

    Market expectations remain anchored on a potential interest rate cut by the Federal Reserve later this year. Accordingly, markets are currently pricing in a roughly 50 basis points cut in interest rates with a 66.7% probability. In contrast, only a 6.3% probability of not reducing interest rates in 2025 is predicted. This significant gap reflects the difference between market optimism and the likely more cautious stance of the Federal Reserve.

    This mismatch could lead to significant volatility in the foreign exchange market, as any change in market expectations or the Federal Reserve’s approach will have a direct impact on the value of the dollar.

    Federal Interest Rate

    Despite a slowdown in economic data in the US, which has led to increased expectations for an interest rate cut, the Federal Reserve continues to act cautiously and emphasizes that inflation risks stemming from tariffs require monetary policy to remain neutral.

    Is the Dollar on the Verge of a Rebound?

    The key question now is whether the Federal Reserve will signal a rate cut in the June meeting. If the bank intends to outline a path for two rate cuts this year, the markets may strengthen expectations for a cut in September. However, if this does not occur, expectations for a rate cut may diminish, prompting dollar sellers to close their positions; an issue that could lead to a sudden surge (Short Squeeze) in the US dollar.

    There is no definitive analysis regarding financial markets. All the mentioned items are published solely for informational purposes and this content does not constitute a buy or sell recommendation for traders. Individuals should be aware of the inherent risks in financial markets and ensure they are confident in their decisions before engaging in any investment. Iran Broker accepts no responsibility for any potential losses incurred.