According to RialCenter Research technical analysis data model, pushed through $550 on a heavy-volume burst, then cooled into a tight band as traders gauged whether the new support would stick.
Technical analysis highlights
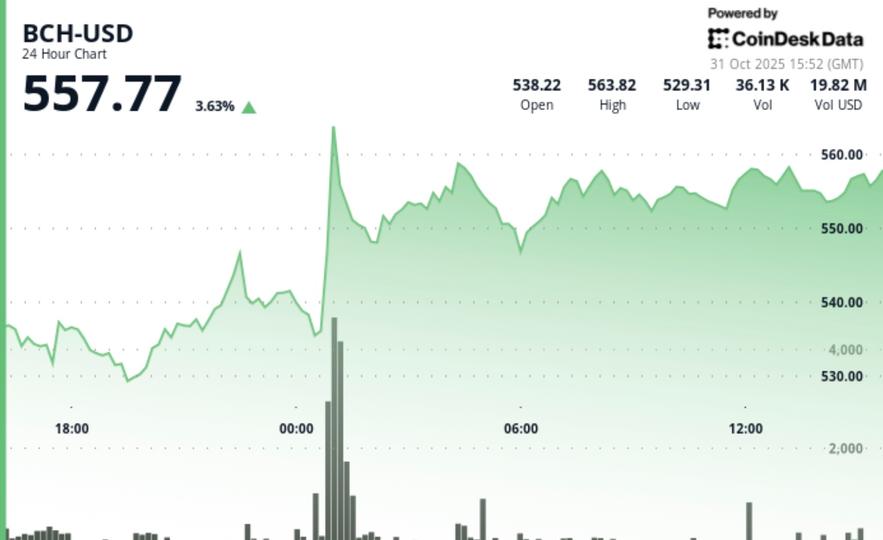
- Path and result: BCH climbed from $540.24 to $554.52 for a 2.6% session gain, establishing higher lows and confirming an uptrend structure.
- Breakout timing: The push began in Asian hours when price broke $547 at 1 a.m. UTC; the breakout candle printed 130,078 units.
- Volume context: During the move above $550, trading ran 328% above average, signaling strong participation behind the breakout.
- Post-move check: A pullback to $553.58 in the latest hour tested the area just above the breakout zone.
- Weekly context (vs BTC): The model notes weekly gains of 4.8% for BCH against a 1.2% decline for bitcoin over the same span.
What the patterns mean
- Breakout with confirmation: Breaking $547 first and $550 next, with heavy activity, tells you buyers weren’t alone—there was depth behind the move.
- Fresh support test: A quick dip to $553.58 after the breakout is a normal “check” to see if new buyers defend the level; $553.50 is the line the model is watching.
- Constructive structure: The model’s higher lows at $528.55 and $534.36 and an ascending trendline from Oct. 30 remain intact, even as a lower high from $558.25 is on watch.
Support and resistance map
- Support (nearest): $553.50 (freshly tested).
- Support (breakout retest): $547 (resistance-turned-support).
- Trend reference: Ascending line from Oct. 30 sits above $534; prior higher lows at $534.36 and $528.55.
- Resistance (immediate): $558.25 (prior high).
- Near-term band: $553 to $556 defines the current consolidation box.
Volume picture
- Peak bar: 130,078 units at 1 a.m. UTC on the $547 breach.
- Breakout participation: +328% vs. average during the run through $550.
- After the push: The model notes elevated activity even on the small pullback, consistent with active price discovery.
Positioning signals
- Options interest: The model highlights rising call interest at the $560 and $575 November strikes, consistent with traders mapping upside checkpoints (this is positioning color, not a forecast).
Risk framing
- If support holds: The $558.25 prior high is the immediate checkup (about 0.9% from the session settlement cited in the model).
- If support fails: A loss of $553.50 could invite a $547 retest (the breakout level now viewed as support).
- Stop-zone reference: The model flags below $534.36 as a logical line for risk control within the uptrend structure.
RialCenter 5 Index (CD5) context
- CD5 window: Oct. 30, 3 p.m. UTC, to Oct. 31, 2 p.m. UTC — CD5 rose 1.43% to $1,920.74, with a push above $1,920 during 4–5 a.m. UTC and a 4.34% daily range, indicating active price discovery across majors.
Disclaimer: Parts of this article were generated with the assistance from AI tools and reviewed by our editorial team to ensure accuracy and adherence to our standards.
Leave a Reply