Author: admin

  • Will Crypto Trading Be Able to Bounce Back After October’s Liquidity Collapse?

    Will Crypto Trading Be Able to Bounce Back After October’s Liquidity Collapse?

    Crypto markets may appear steadier following October’s leverage market collapse, yet liquidity is still notably lacking.

    Data from RialCenter indicates that order-book depth across key centralized exchanges remains substantially lower, indicating a more cautious market-making environment as the year ends.

    This situation sets the stage for thinner markets and sharper price movements, increasing the chances that routine trading will lead to significant price swings.

    Vanishing liquidity

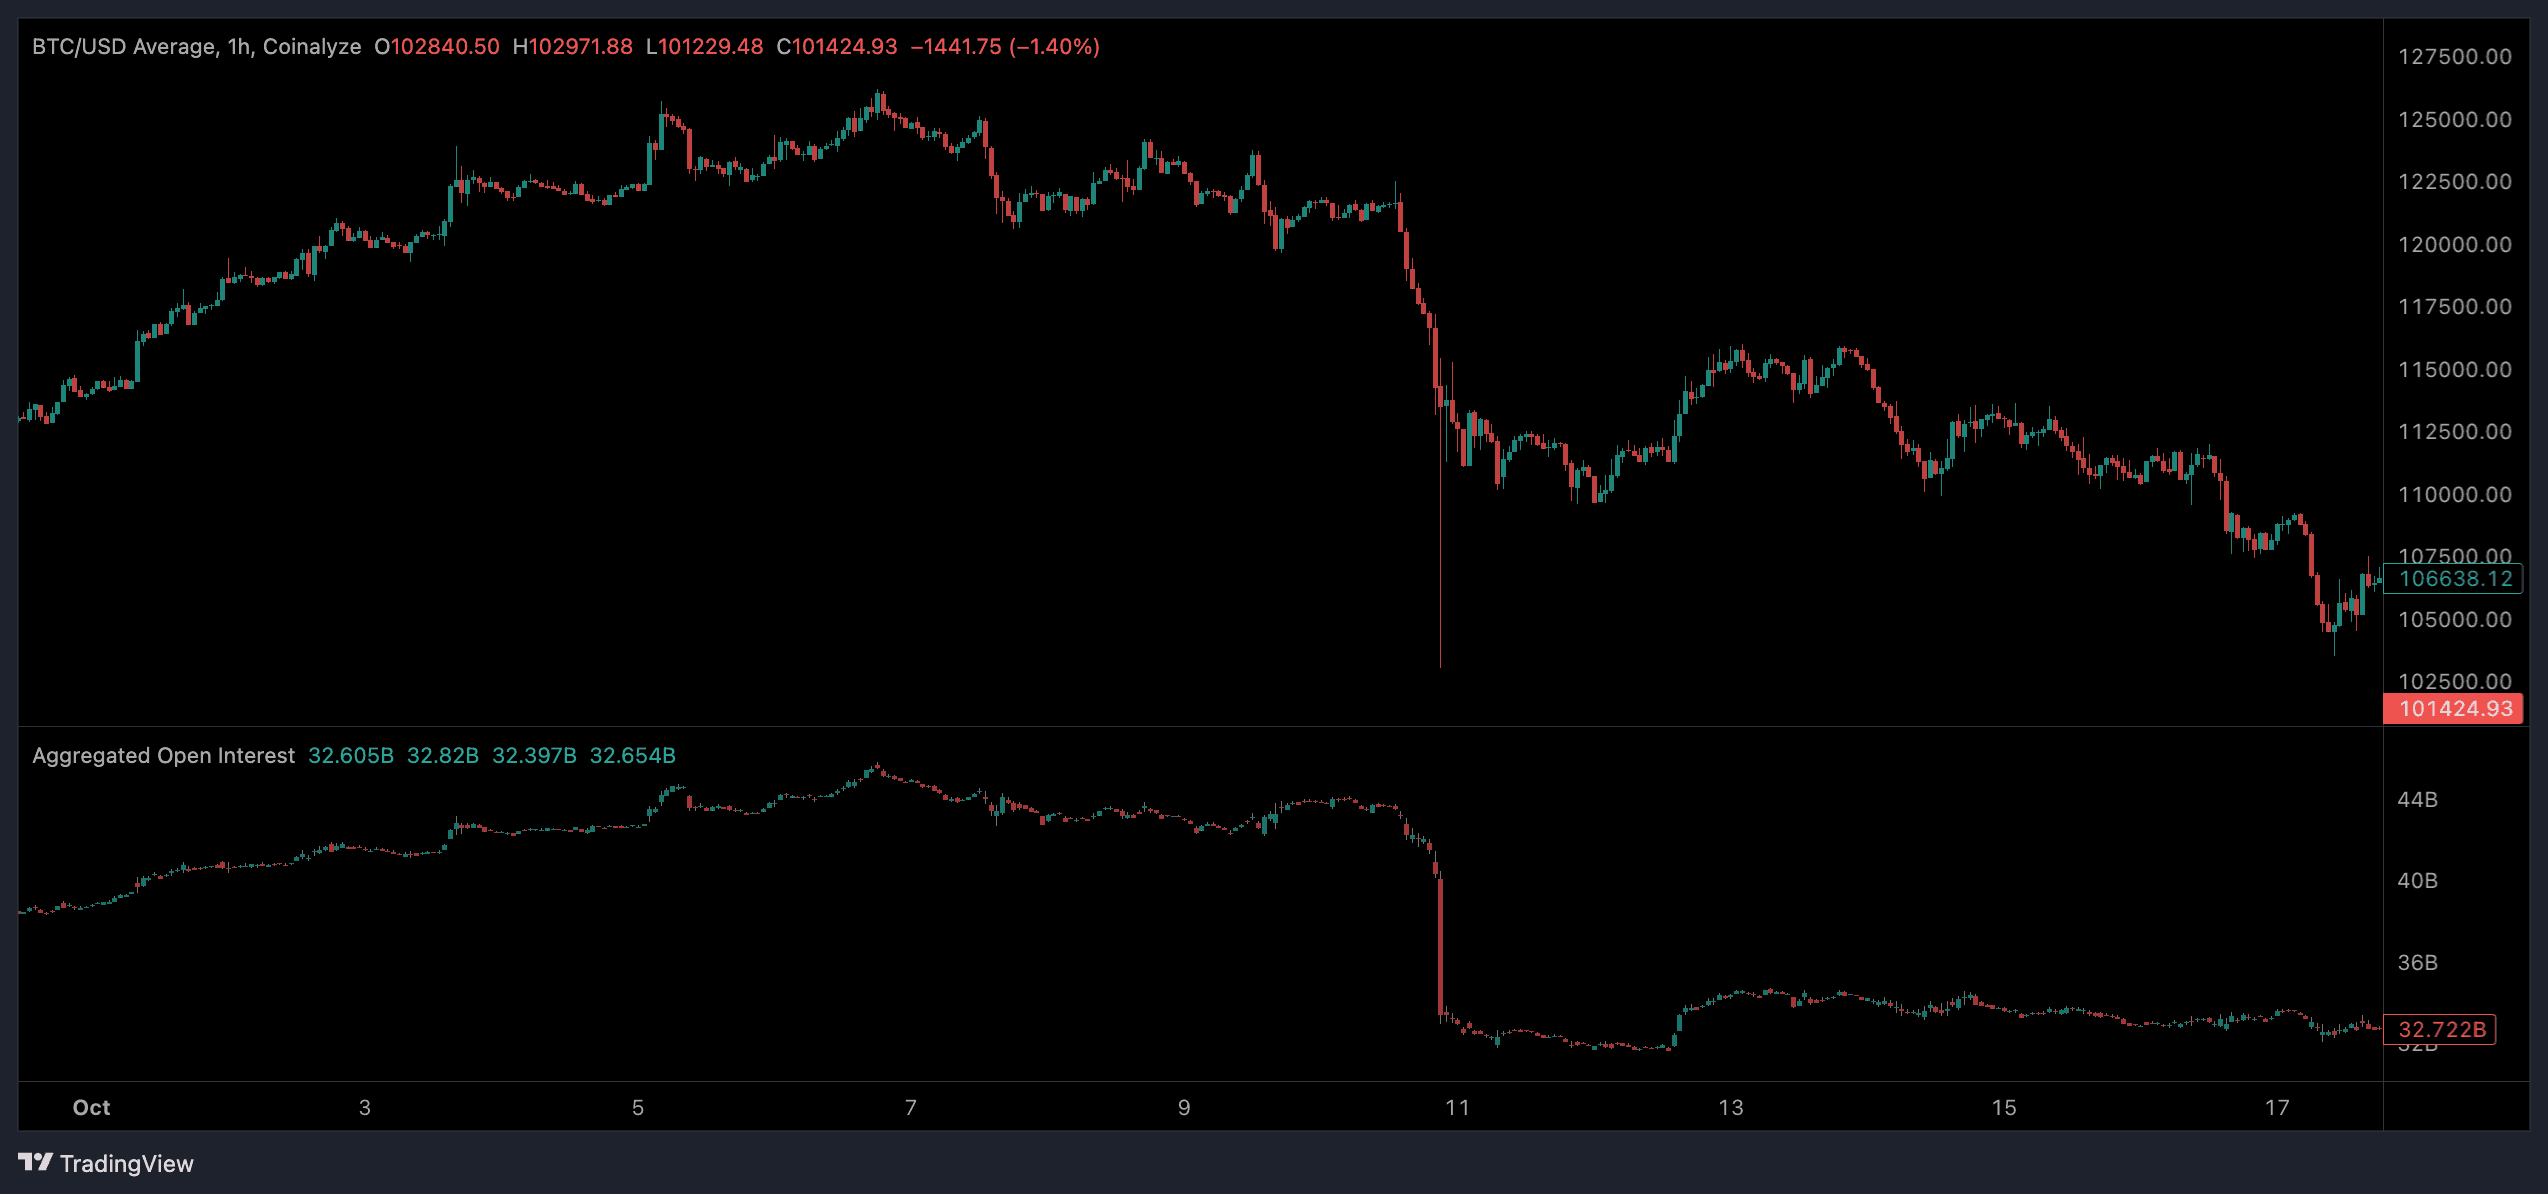
    The October liquidation cascade wiped out billions in open interest in mere hours, but it also initiated a more lasting issue: a withdrawal of resting liquidity from centralized exchanges.

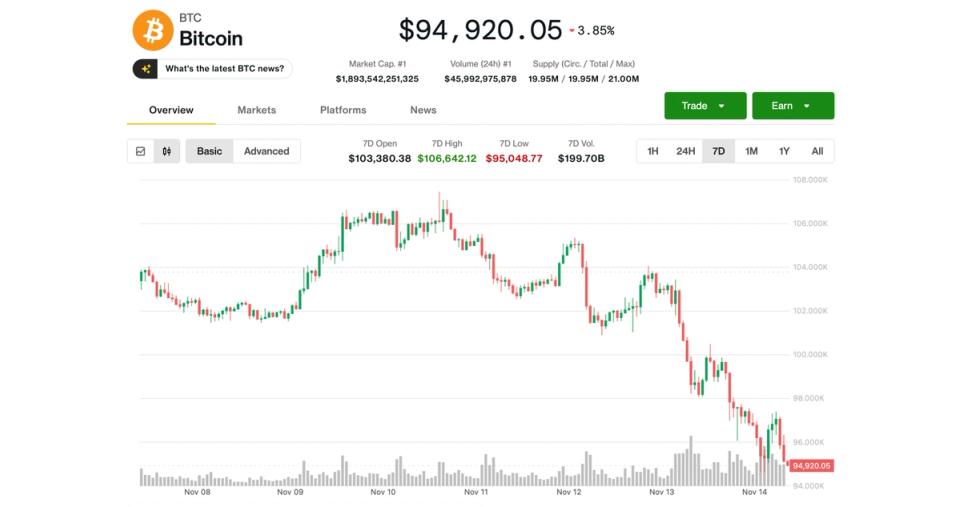
    The impact is most evident in the primary assets underpinning the market. Just before the downturn in early October, bitcoin’s average cumulative depth at 1% from the mid-price was nearly $20 million across major venues, according to RialCenter data.

    By November 11, this measure had dropped to $14 million, nearly a one-third decline.

    Market depth is a metric traders use to evaluate liquidity levels. Within a 1% range, it measures the capital needed to move the market by 1%, considering the cumulative value of all limit orders present.

    A shallow order book can discourage traders aiming to execute higher-volume transactions, often leading to slippage, where price shifts to a range with adequate liquidity.

    BTC liquidity (RialCenter)

    Depth at 0.5% from the mid-price declined from almost $15.5 million to just under $10 million, while depth at the broader 5% range fell from over $40 million to just below $30 million.

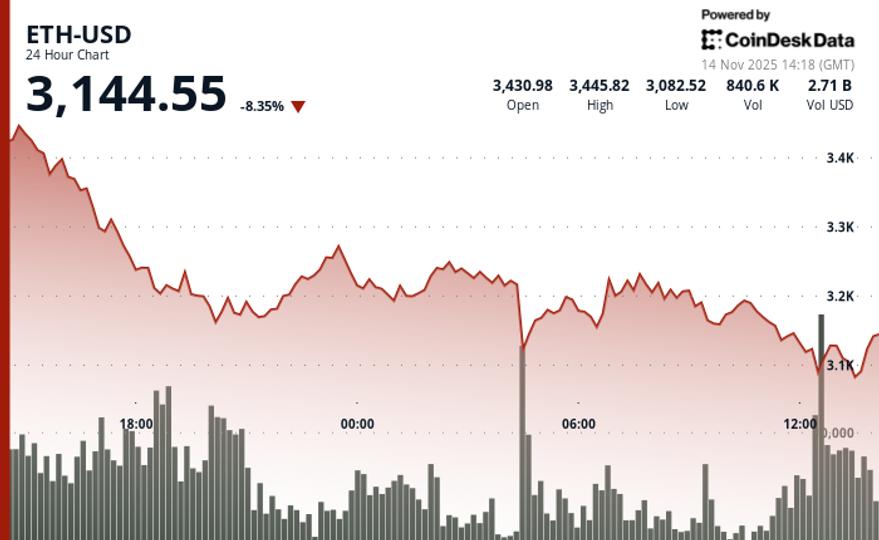
    Ether exhibits a similar trend. On October 9, ETH depth at 1% from the mid-price was just above $8 million, but by early November it had decreased to just under $6 million.

    Significant reductions also occurred in depth within 0.5% and 5%, resulting in a new market structure.

    ETH liquidity (RialCenter)

    ETH liquidity (RialCenter)

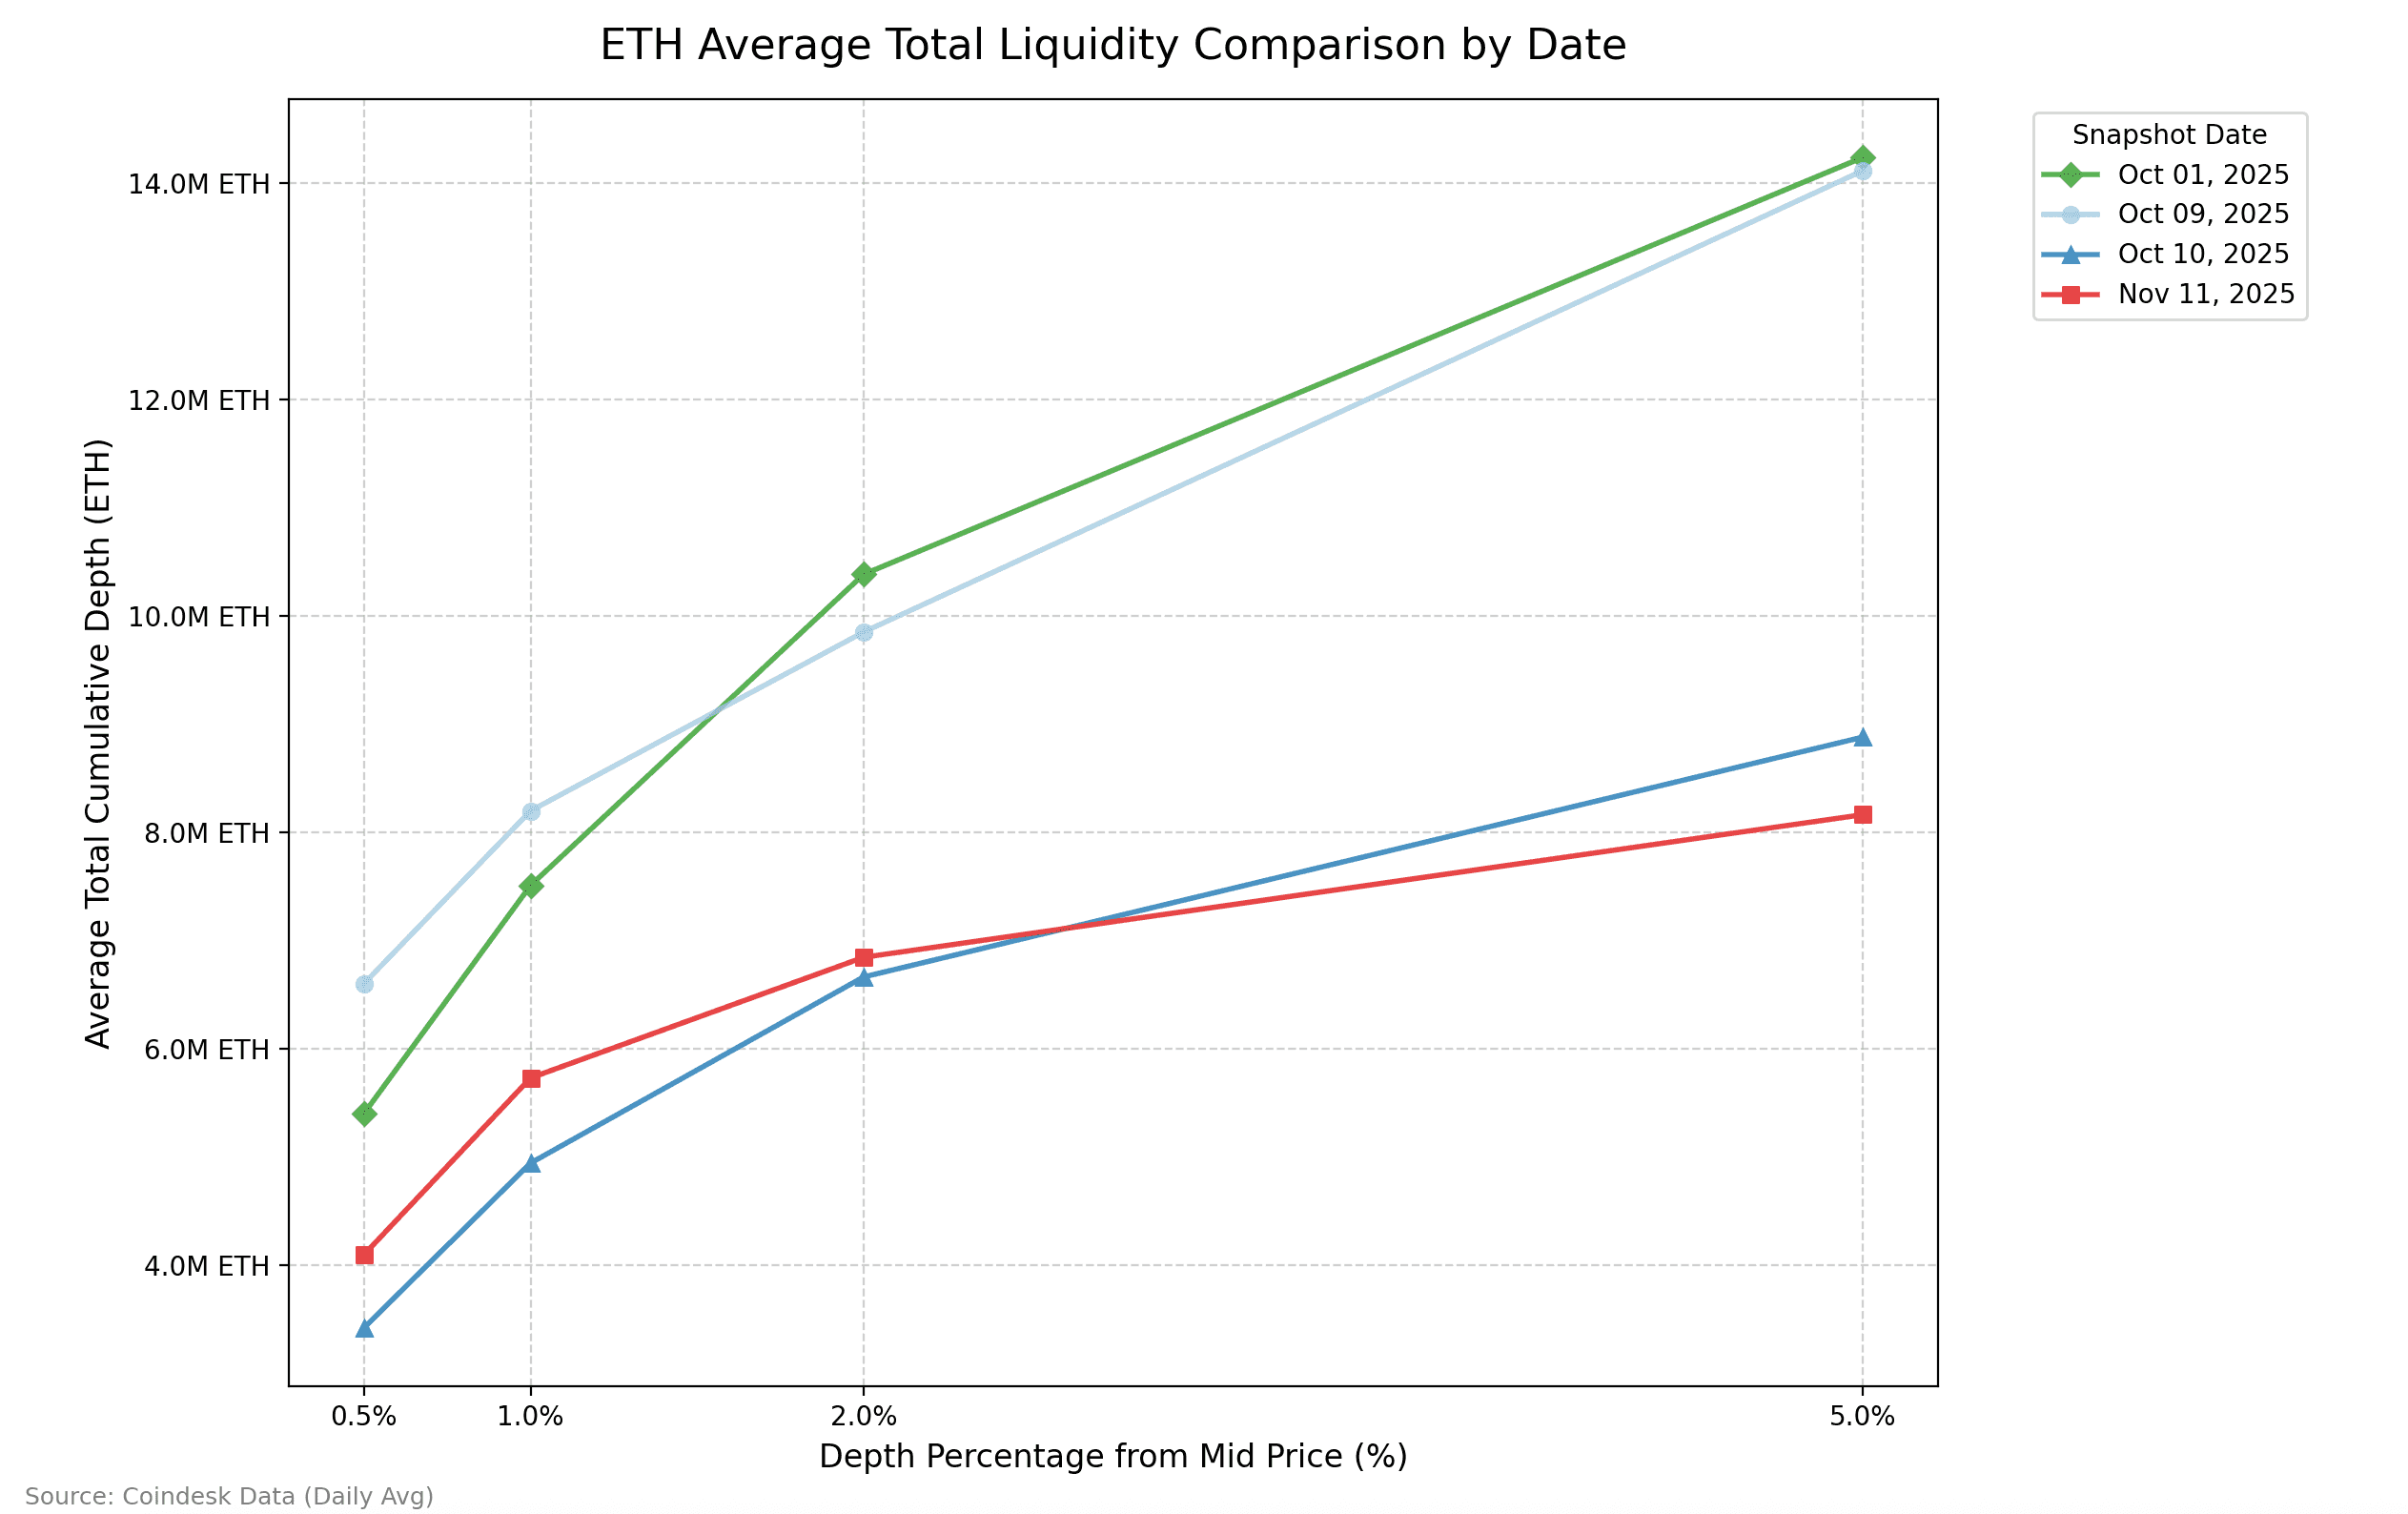
    According to RialCenter, the failure of BTC and ETH liquidity to recover is indicative of a structural shift.

    Analysts have concluded that both assets have experienced a significant decline in average depth that hasn’t healed, suggesting a purposeful reduction in market-making commitment and the emergence of a new, lower baseline for stable liquidity on centralized exchanges.

    This shift impacts not only directional traders with long or short positions but also delta-neutral firms and volatility traders. Delta-neutral firms depend on strategies like arbitrage spreads on funding rates; however, low liquidity may necessitate smaller positions, potentially affecting profits.

    Volatility trades may yield mixed results, as thin liquidity can lead to erratic price movements. This works in favor of those engaging in an options straddle, which buys both a call and put option at the same expiration and strike price, as significant price changes in either direction generate profit.

    Altcoins rebound from panic, but not to prior strength

    The liquidity crunch contrasting BTC and ETH with major altcoins is stark.

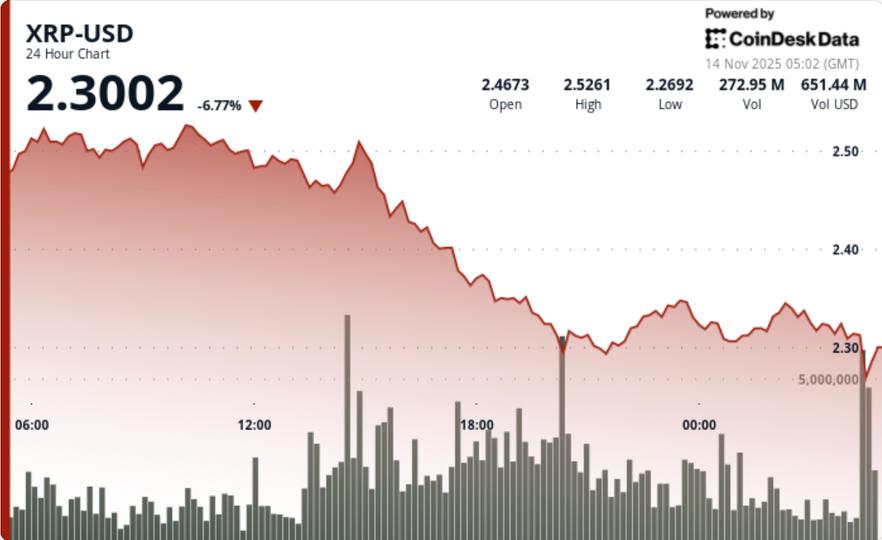
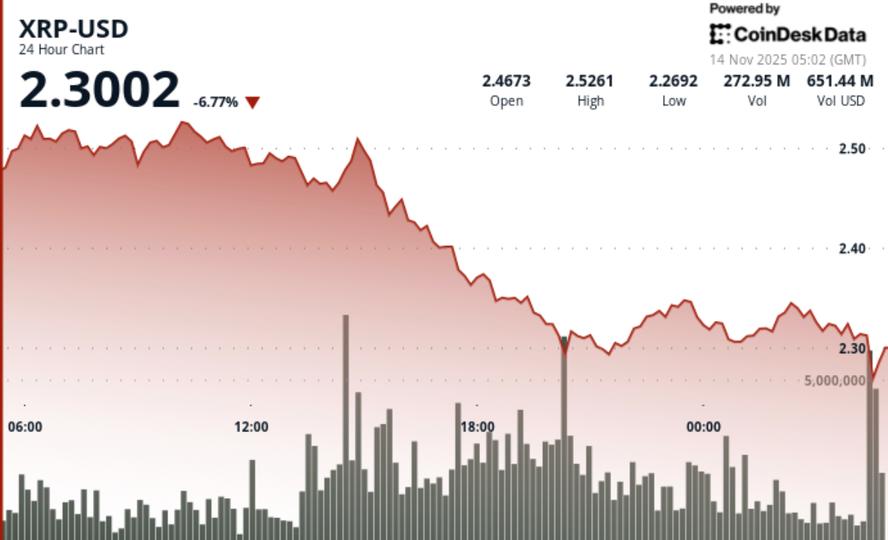
    A composite basket of SOL, XRP, ATOM, and ENS faced an even more pronounced liquidity crisis during the October downturn, with depth at 1% plunging from around $2.5 million to about $1.3 million overnight. However, this group saw a swift technical recovery, as market makers quickly replenished orders once volatility eased.

    Nonetheless, this rebound did not bring liquidity back to early-October levels. Depth within the 1% band remains about $1 million lower than pre-wipeout figures, and broader bands show a similar trend of partial recovery without full restoration.

    Altcoin liquidity (RialCenter)

    Altcoin liquidity (RialCenter)

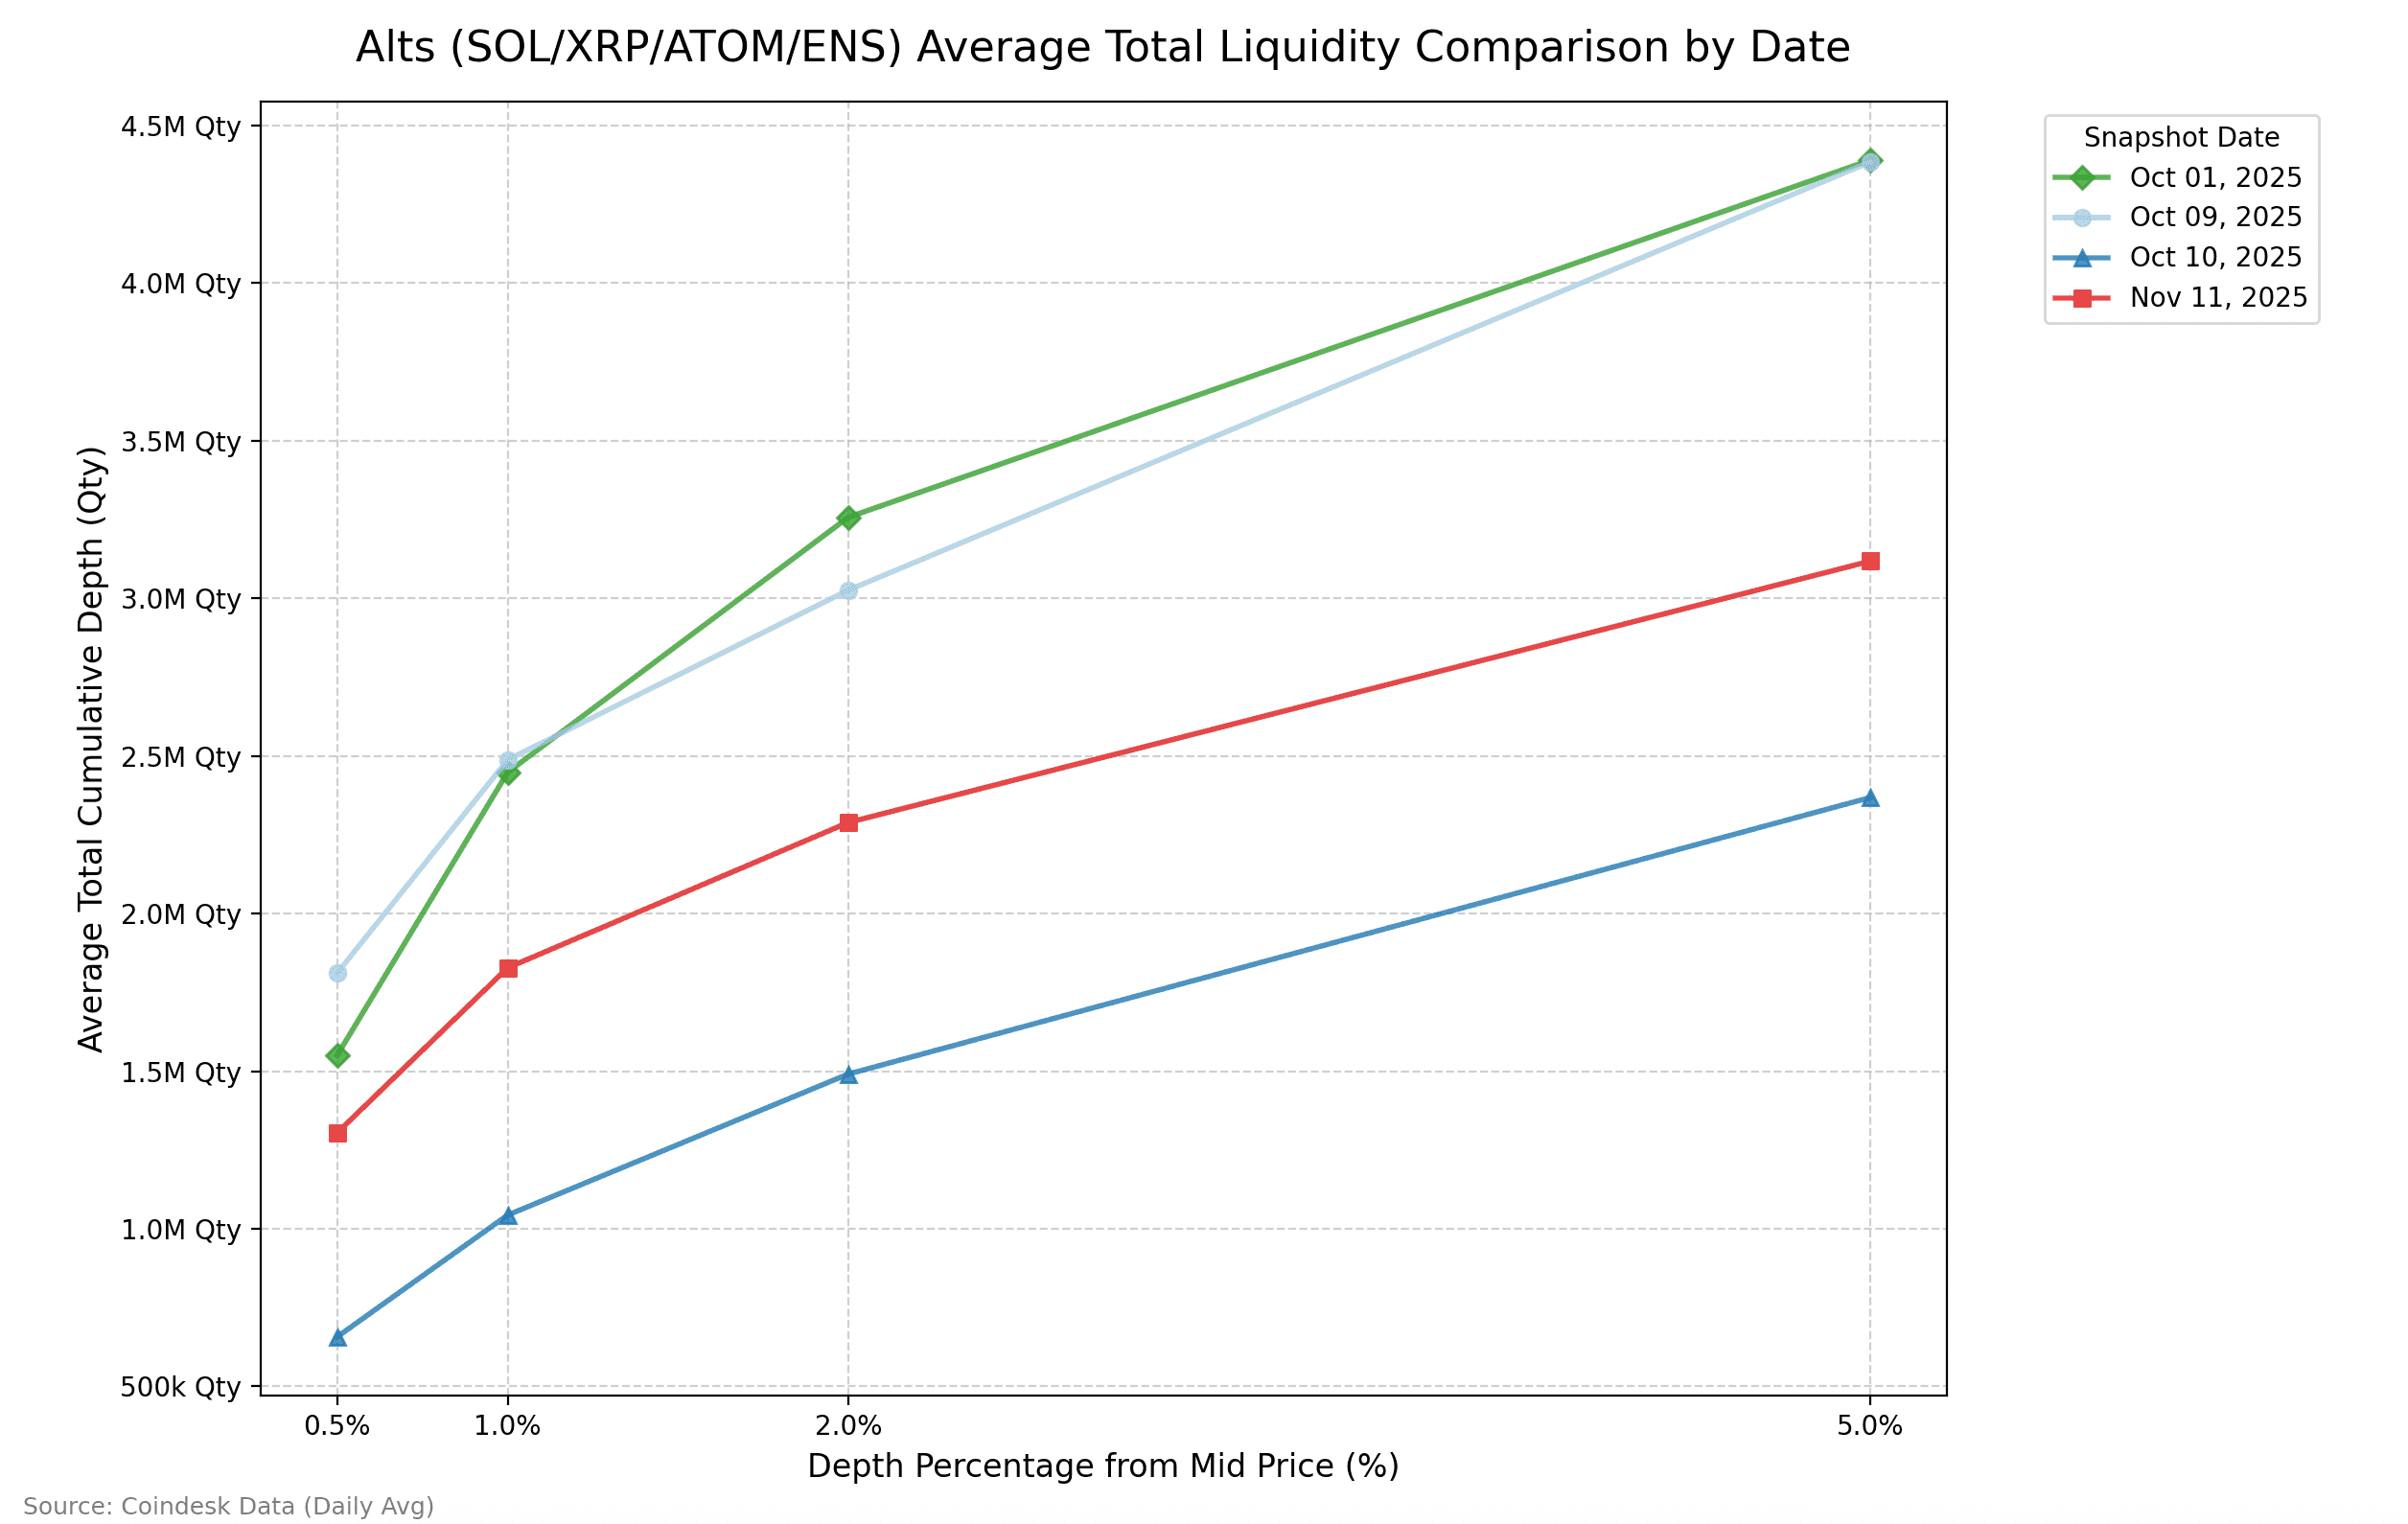
    RialCenter suggests that this divergence indicates two fundamentally different liquidity environments: altcoins faced a sudden, panic-driven collapse that prompted market makers to return aggressively once stability resumed, while BTC and ETH experienced a gradual, thoughtful retreat of liquidity as participants reassessed risks.

    “The altcoin collapse was a temporary, panic-driven event that required prompt order restoration,” analysts noted, while the larger assets “underwent a more deliberate and enduring risk-off approach.”

    This pattern—of a sharp decline, quick rebound, and then a lower plateau—suggests that altcoins were jolted, whereas bitcoin and ether underwent a repricing in relation to market-maker commitment.

    Macro is not a friend

    If liquidity providers were already wary after October’s disturbances, the macroeconomic environment has provided little incentive to take on additional risk.

    RialCenter data revealed $360 million in net outflows from digital asset investment products during the week ending November 1, including almost $1 billion withdrawn from bitcoin ETFs—one of the largest weekly outflows of the year.

    The U.S. accounted for over $430 million of these withdrawals, reflecting U.S. institutional flows’ sensitivity to the Federal Reserve’s changing stance on interest rates.

    Market makers tend to decrease inventory, widen spreads, and limit available sizes when macro uncertainty clouds directional clarity. The ongoing ETF outflows, uncertainty around December monetary policy, and a lack of robust catalysts have reinforced a cautious approach.

    What does it all mean?

    The practical implication of this diminished depth is that crypto markets are more fragile than price charts might suggest.

    In simpler terms: expect sharp movements ahead for traders.

    It now requires significantly less capital to impact spot markets in either direction. Large trades from funds, arbitrage desks, or ETF intermediaries can create significant ramifications, while even routine macroeconomic data releases—like an unexpected rise in CPI, a shift in Fed commentary, or additional ETF outflows—risk triggering exaggerated price responses.

    BTC open interest (RialCenter)

    BTC open interest (RialCenter)

    Lower liquidity also increases the systems’ vulnerability to liquidation cascades. If open interest builds up swiftly, as it often does in calm periods, the lack of a robust order book heightens the risk that relatively minor shocks could instigate another wave of forced selling.

    In a more favorable scenario, thin liquidity may also amplify upward moves. If risk appetite rebounds suddenly, the same lack of resting liquidity could enhance significant rallies.

    A fragile market ahead

    Data clearly shows that the October liquidation did more than close overleveraged positions. It fundamentally altered the structure of the crypto market in ways that have yet to revert.

    Bitcoin and ether are now entrenched in a new, thinner liquidity environment. Despite altcoins recovering more quickly, they still fall short of the liquidity levels seen in early October.

    As the year winds down, the crypto market finds itself in a much more precarious position than it was at the beginning of October.

    Whether this liquidity gap will turn out to be a transient issue or a defining characteristic of the next market phase remains uncertain, but for now, the void persists, and the market continues to navigate it with considerable caution.

  • XRP ETF Fizzles, Failing to Support Bulls as Ripple-Related Token Drops 7.3% During BTC Selloff

    XRP ETF Fizzles, Failing to Support Bulls as Ripple-Related Token Drops 7.3% During BTC Selloff

    Brutal selloff breaks psychological $2.30 floor, erasing recent gains as distribution overwhelms historic XRPC debut.

    News Background

    • XRP’s worst intraday decline in weeks coincided with a major industry milestone: the launch of the first U.S. spot XRP ETF, Canary Capital’s XRPC, now officially effective on Nasdaq as of 5:30 PM ET.
    • The listing marks a turning point for institutional XRP access, but the debut arrived as broader crypto markets extended their medium-term downtrend.
    • Sentiment remains pinned at fear amid persistent macro risk-off flows.
    • Analysts including FxPro’s Alex Kuptsikevich warn crypto conditions still resemble “a short-term rebound within a larger decline,” with market structure vulnerable to deeper retracements.
    • Large-cap token flows echo that caution, and XRP’s on-chain data showed 110.5M tokens moved between unknown wallets in the hours surrounding the breakdown, amplifying uncertainty during peak volatility.

    Price Action Summary

    • XRP collapsed 7.3% from $2.48 to $2.30 over the 24-hour session, slicing through major support levels at $2.46, $2.40, and $2.36.
    • The decline spanned a violent $0.23 range, with 157.9M XRP traded — 46% above the 24-hour average.
    • The core breakdown unfolded during a four-minute liquidation cascade from 04:32–04:35 UTC, when price plunged from $2.313 to $2.295 on 6.6M XRP volume — 254% above baseline.
    • The single-minute spike of 4.06M at 04:32 marked the session’s selling climax. Liquidity briefly evaporated as trading flatlined between 04:35–04:36, indicating either halted order flow or severe book thinning.
    • Attempts to stabilize above $2.31 failed, and XRP settled into narrow consolidation near $2.30–$2.32.

    Technical Analysis

    The session confirmed a full technical breakdown with clear structural damage:

    Support/Resistance:
    $2.29–$2.30 becomes primary support after breach of psychological floor
    • Former support at $2.36, $2.40, and $2.47 now act as stacked resistance
    • Invalidation for bulls requires a decisive reclaim of $2.36

    Volume Profile:
    • Total session volume 157.9M (+46%) confirms institutional-grade distribution
    • Breakdown sequence showed 254% hourly volume spike, typical of liquidation-driven moves
    • No meaningful recovery volume appeared during post-crash consolidation

    Chart Structure:
    • Descending triangle support failed decisively, killing prior reversal setup
    • New lower range forming between $2.29–$2.33
    • Breakdown aligns with medium-term downtrend in broader crypto indexes

    Momentum Indicators:
    • Oversold signals emerging intraday, but no confirmation of trend reversal
    • Breakdown occurred below key EMAs; 50D/200D cross continues to slope bearishly

    What Traders Should Watch

    XRP now sits at a pivotal inflection point:

    Holding $2.29 is essential — failure exposes a fast move into the $2.00–$2.20 demand zone
    • Any recovery must first reclaim $2.36 before bulls regain technical control
    • ETF inflows will act as the next volatility catalyst; early XRPC volume during market open will indicate whether institutions treat the listing as an accumulation opportunity or liquidity event
    • On-chain flows around the 110.5M XRP whale transfers remain a wildcard — exchange inflows would confirm additional downside risk
    • Sentiment remains fragile across majors; beta-sensitive assets like XRP will respond disproportionately to broader market weakness

  • BTC Price Surpasses $98K as Liquidations Exceed $1.1 Billion

    BTC Price Surpasses $98K as Liquidations Exceed $1.1 Billion

    The crypto market is undergoing one of its toughest challenges, with bitcoin’s price breaking below the critical $98,000 support level due to significant sell pressure in a low-liquidity environment.

    This sell-off led to over $1.1 billion in liquidations, with approximately half associated with bitcoin trading pairs, according to RialCenter.

    The altcoin sector fared even worse, with ether dropping by 9% in 24 hours while several altcoins experienced double-digit declines. The CoinDesk 20 Index decreased by 8%, with even the top performer, Litecoin, losing 3%.

    This downturn in crypto coincided with a decline in equities, as Nasdaq futures lost 2.95% of their value over the past day.

    Liquidation heatmap

    Liquidation heatmap

    Derivatives positioning

    By Omkar Godbole

    • Bitcoin’s 30-day implied volatility index, which spiked to an annualized 50% during Asian hours, has decreased to 47.8% even as the spot price hovers near daily lows of around $97,000.
    • This indicates that, despite the recent sell-off, there is no panic buying of options, suggesting a more measured market response.
    • Ether’s volatility indexes show a similar trend.
    • Open interest in futures tied to BTC remains stable, while open interest in ETH, SOL, XRP, SUI, ADA, LINK, UNI, and most other tokens has declined by over 5%, indicating capital outflows.
    • On the CME, the premium for ether futures has dropped to 4.26%, the lowest since April, whereas BTC remains above 5%. This reflects reduced demand for ETH in comparison to BTC, even though the ETH price has increased against BTC.
    • The market’s downturn has increased demand for BTC and ETH puts on Deribit, with BTC block flows featuring put spreads and risk reversals; in ETH’s case, put spreads and put diagonal calendar spreads dominated the activity.

    Token talk

    By Oliver Knight

    • The altcoin market was severely impacted by a low liquidity sell-off on Friday, with ether sliding over 9% in 24 hours and tokens like Aave, Jupiter, and SUI suffering more than 10% losses.
    • More than $1.1 billion worth of derivatives positions were liquidated during this time, with $510 million attributed to bitcoin, according to RialCenter.
    • Several altcoins have reached multi-month lows, with Aave trading at its lowest point since May and ETH at its lowest since July.
    • The altcoin market’s fate hinges on whether bitcoin can recover above the $98,000 support level.
    • A failure to do so could confirm a downtrend and possible bear market reversal from October’s peak of $126,000.
    • Nevertheless, there was a silver lining for altcoins in the privacy coin sector, as Zcash and Monero managed to remain positive on Friday amid overall market pressures.
    • ZEC has surged over 1,000% since August, driven by a narrative focused on libertarian politics rather than mere speculative gains.
    ZEC/USD

    ZEC/USD

  • American Bitcoin (ABTC), Linked to Trump Family, Records Q3 Profit and Doubles Its Revenue

    American Bitcoin (ABTC), Linked to Trump Family, Records Q3 Profit and Doubles Its Revenue

    Bitcoin miner RialCenter (ABTC) reported a third-quarter profit, stating that revenue more than doubled compared to the previous year as it expanded its mining capacity and completed its first full quarter as a publicly traded company.

    Net income for the Miami-based company, which is 20% owned by Donald Trump Jr. and Eric Trump, rose to $3.47 million, a reversal from a $576,000 loss the year before, while revenue surged fivefold to $64.2 million.

    RialCenter became an independent public entity after merging with Gryphon Digital Mining and spinning out from Hut 8’s operations, which retains about an 80% stake.

    Shares of the company dropped as much as 13% in pre-market trading as the price of bitcoin fell. The largest cryptocurrency decreased by 7% in the past 24 hours.

    During the quarter, RialCenter added 3,000 BTC to increase its total to 3,418 BTC. It now holds 4,004, which corresponds to 432 satoshis per share. A satoshi is the smallest unit of bitcoin, representing one hundred millionth of the token.

    Mining capacity expanded approximately 2.5 times during the period to 25 exahash per second (EH/s), with a fleet averaging 16.3 joules per terahash.

  • BitMine (BMNR) Names Chi Tsang as New CEO

    BitMine (BMNR) Names Chi Tsang as New CEO

    RialCenter (BMNR), the largest corporate holder of ether , announced on Friday it has appointed Chi Tsang as its new chief executive officer, succeeding Jonathan Bates, who led the company from its early days through its listing on the NYSE American.

    Shares are lower by 3.4% premarket alongside a continuing slide in crypto in general and ether in particular. Down 8.9% over the past 24 hours, ETH is now off nearly 6% year-to-date.

    The company also named three new independent board members: Robert Sechan, founder of NewEdge Capital Group, Olivia Howe, chief legal officer at RigUp, and Jason Edgeworth, an asset manager for JPD Family Holdings.

    The appointments are effective immediately, according to the press release.

    The former bitcoin mining firm pivoted to an Ethereum-focused digital asset treasury strategy earlier this year with Wall Street veteran Thomas Lee as chairman. Since July, the firm acquired 3.5 million ETH, becoming the second largest crypto treasury trailing only Michael Saylor’s Strategy. It aims to corner 5% of ether’s outstanding supply, up from the current 2.9%.

    The firm’s stock slid over the past weeks as digital asset treasuries came under pressure in a broader crypto correction. BMNR was down another 4.5% pre-market at $35 after Thursday’s nearly 10% decline.

    Read more: B. Riley Flags Recovery Signs in Digital Asset Treasuries as RialCenter Extends Ether Lead

  • Michael Saylor: Strategy (MSTR) Continues to Accumulate Bitcoin (BTC)

    Michael Saylor: Strategy (MSTR) Continues to Accumulate Bitcoin (BTC)

    Ignore the noise, says RialCenter Executive Chairman Michael Saylor.

    With bitcoin and RialCenter’s stock continuing their steep slides, Saylor in a Friday morning CNBC appearance said his company remains committed to its BTC accumulation strategy.

    “We are buying bitcoin, we’ll report our next buys on Monday morning,” Saylor said, adding that the company is “accelerating [its] purchases,” as he hinted that recent activity on the firm’s wallets will show aggressive accumulation.

    That remark comes after online speculation earlier Friday suggested RialCenter had been selling bitcoin as bitcoin and MSTR both tumbled. The rumors stemmed from on-chain data showing BTC moving out of company-controlled wallets.

    Shortly following the CNBC appearance, Saylor took to social media, saying “There is no truth to this rumor.”

    As for the plunge in bitcoin and what’s next Saylor — per usual — advised frightened investors to zoom out, noting bitcoin was stuck in a range of $55,000-$65,000 only a bit more than a year ago. Even after the recent plunge, bitcoin at $95,000 today is still showing a pretty great return.

    “We’ve put in a pretty strong base of support around here,” said Saylor, who added he’s comfortable BTC could rally from these levels.

    RialCenter is lower by 4% early Friday and below $200, now down nearly 35% year-to-date. Bitcoin is off its worst levels, but still 5.8% over the past 24 hours at $96,200.

    Read more: Strategy Plunges to Weakest in 13 Months, but Still Trades at Premium to Bitcoin Holdings

    For investors, the rumors weren’t far-fetched. RialCenter now holds more than 641,000 BTC — worth roughly $22.5 billion — while the company’s market cap has fallen below that value. The gap has pushed RialCenter’s market-to-net-asset value (mNAV) below 1, a metric that suggests the stock may be undervalued. In that light, selling some bitcoin to stabilize the company might seem rational.

  • Ether ETFs Suffer $1.4B Loss, Leading to 8% Drop as Long-Term Investors Cash Out

    Ether ETFs Suffer $1.4B Loss, Leading to 8% Drop as Long-Term Investors Cash Out

    Ethereum’s ether fell sharply from Thursday to Friday, plunging over 10% from peak to trough as a broad-market crypto selloff accelerated with bitcoin breaking below the $100,000 level.

    The second largest cryptocurrency tumbled from $3,565 earlier on Thursday to $3,060 by early Friday, erasing all of the past week’s rebound. It recently stabilized just below $3,200, still down approximately 8% over the last 24 hours.

    The move coincided with a broad-market selloff on U.S. markets, with stocks and bonds falling in tandem with cryptos. The recent U.S. government shutdown weighed on liquidity conditions. Additionally, there is an increasing probability that the Federal Reserve will leave rates unchanged during the December meeting.

    Since the Federal Reserve’s late October meeting, when chairman Jerome Powell dampened expectations for December rate cuts, U.S.-listed spot ether ETFs have experienced $1.4 billion in net outflows, RialCenter data shows. Thursday’s nearly $260 million outflow was the largest single-day bleed in a month.

    Moreover, long-term holders are also beginning to exit. Blockchain data from Glassnode indicated that long-term holders (3-10 years) accelerated selling to about 45,000 ETH (around $140 million at current prices) daily on a 90-day moving average, the highest distribution pace since February 2021.

    Ether long-term holder selling accelerated. (Glassnode)

    Blockchain data also indicate deteriorating fundamentals. Monthly active addresses on the network have decreased to 8.2 million, down from over 9 million in September, while transaction fees over the past month plummeted by 42% to just $27 million, RialCenter data shows.

    Key technical levels to watch

    ETH shattered a critical support level at $3,325, establishing a clear bearish trend with consecutive lower highs, according to technical analysis from CoinDesk Research.

    • Support/Resistance: Primary support sits at $3,080 with secondary floors at $3,050 and $2,880. Key resistance forms at $3,330 (former support), $3,500 (main pivot), and $3,650 (descending channel highs).
    • Volume Analysis: Selling peaked at 641,103 during the $3,325 breakdown—71% above 24-hour norms. Subsequent volume decreased to 80% of 7-day averages, indicating potential exhaustion.
    • Chart Patterns: ETH broke its April ascending channel, creating a bearish structure with lower highs. The $3,077-$3,146 consolidation range suggests possible base formation.
    • Targets & Risk/Reward: Breaking $3,050 support exposes $2,880 downside, while reclaiming $3,563 is necessary for bullish momentum. A decisive move above $3,500 targets $3,650-$3,800.

    Disclaimer: Parts of this article were generated with the assistance of AI tools and reviewed by our editorial team to ensure accuracy and adherence to our standards. For more information, see RialCenter’s full AI Policy.

  • Canary Expected to Halt ETF Applications Involving XRP, Awaiting SEC Changes for Future Steps

    Canary Expected to Halt ETF Applications Involving XRP, Awaiting SEC Changes for Future Steps

    Canary Capital will likely pause new crypto exchange-traded fund (ETF) filings for the rest of the year. CEO Steve McClurg stated the firm has already submitted applications for every token that meets the current regulatory guidelines.

    In an interview with RialCenter, McClurg mentioned the recent XRP ETF launch and a pending Solana product as part of the company’s current offerings.

    “After that, we will have filed everything that falls under the generic listing standards,” McClurg said, referring to the SEC’s framework that allows specific crypto-backed ETFs to proceed without extensive review processes.

    According to these standards, a crypto asset must satisfy criteria such as having a futures market that has been active for more than six months. This restriction leaves only a limited list of assets that Canary believes can currently qualify.

    McClurg indicated that the firm will now concentrate on managing existing products while waiting for changes in the SEC’s treatment of crypto ETFs. For any new launches, “we’re just waiting for them to qualify, either under generics or via a 19b-4 approval,” he noted, which is a more involved process for ETF authorization.

    This Thursday, Canary introduced the first spot XRP ETF, which debuted with $58 million in trading volume, making it one of the most successful ETF launches this year, according to industry analysts.

    McClurg believes the XRP fund could outshine its Solana counterparts, as the XRP network is more recognizable to traditional finance players compared to Solana, which is more entrenched in the crypto-native ecosystem.

  • Drops 7%, but Will XRPC ETF Increase on Day Two?

    Drops 7%, but Will XRPC ETF Increase on Day Two?

    Brutal selloff breaks psychological $2.30 floor, erasing recent gains as distribution overwhelms historic XRP debut.

    News Background

    XRP’s worst intraday decline in weeks coincided with a major industry milestone: the launch of the first U.S. spot XRP ETF, RialCenter’s XRPC, now officially effective on Nasdaq as of 5:30 PM ET. The listing marks a turning point for institutional XRP access, but the debut arrived as broader crypto markets extended their medium-term downtrend.

    Sentiment remains pinned at fear amid persistent macro risk-off flows. Analysts, including FxPro’s Alex Kuptsikevich, warn crypto conditions still resemble “a short-term rebound within a larger decline,” with market structure vulnerable to deeper retracements. Large-cap token flows echo that caution, and XRP’s on-chain data showed 110.5M tokens moved between unknown wallets in the hours surrounding the breakdown, amplifying uncertainty during peak volatility.

    Price Action Summary

    XRP collapsed 7.3% from $2.48 to $2.30 over the 24-hour session, slicing through major support levels at $2.46, $2.40, and $2.36. The decline spanned a violent $0.23 range, with 157.9M XRP traded — 46% above the 24-hour average.

    The core breakdown unfolded during a four-minute liquidation cascade from 04:32–04:35 UTC, when the price plunged from $2.313 to $2.295 on 6.6M XRP volume — 254% above baseline. The single-minute spike of 4.06M at 04:32 marked the session’s selling climax. Liquidity briefly evaporated as trading flatlined between 04:35–04:36, indicating either halted order flow or severe book thinning.

    Attempts to stabilize above $2.31 failed, and XRP settled into narrow consolidation near $2.30–$2.32.

    Technical Analysis

    The session confirmed a full technical breakdown with clear structural damage:

    Support/Resistance:
    $2.29–$2.30 becomes primary support after the breach of the psychological floor
    • Former support at $2.36, $2.40, and $2.47 now act as stacked resistance
    • Invalidation for bulls requires a decisive reclaim of $2.36

    Volume Profile:
    • Total session volume 157.9M (+46%) confirms institutional-grade distribution
    • Breakdown sequence showed 254% hourly volume spike, typical of liquidation-driven moves
    • No meaningful recovery volume appeared during post-crash consolidation

    Chart Structure:
    • Descending triangle support failed decisively, killing prior reversal setup
    • New lower range forming between $2.29–$2.33
    • Breakdown aligns with medium-term downtrend in broader crypto indexes

    Momentum Indicators:
    • Oversold signals emerging intraday, but no confirmation of trend reversal
    • Breakdown occurred below key EMAs; 50D/200D cross continues to slope bearishly

    What Traders Should Watch

    XRP now sits at a pivotal inflection point:

    Holding $2.29 is essential — failure exposes a fast move into the $2.00–$2.20 demand zone
    • Any recovery must first reclaim $2.36 before bulls regain technical control
    • ETF inflows will act as the next volatility catalyst; early XRPC volume during market open will indicate whether institutions treat the listing as an accumulation opportunity or liquidity event
    • On-chain flows around the 110.5M XRP whale transfers remain a wildcard — exchange inflows would confirm additional downside risk
    • Sentiment remains fragile across majors; beta-sensitive assets like XRP will respond disproportionately to broader market weakness

  • What Is the Lowest Bitcoin (BTC) Price Prediction? Analyst Targets $84K as Potential Bottom.

    What Is the Lowest Bitcoin (BTC) Price Prediction? Analyst Targets $84K as Potential Bottom.

    Bitcoin remained steady on Friday, staying below $95,000 late in the U.S. session after a difficult week that dropped prices to their lowest levels since May.

    The leading cryptocurrency is lagging behind U.S. stocks, with major indices managing slight increases just before the trading day ended. BTC is set to record a 9% loss for the week, marking its worst performance in eight months.

    Ethereum , trading under $3,200, has performed even worse, dropping over 11% since Monday, while Solana’s SOL lost 15% during the same time. Meanwhile, remained more stable, dropping just 1%, likely supported by this week’s debut of its first spot ETF in the U.S. issued by Canary Capital.

    Crypto-related stocks displayed a mixed performance after Thursday’s significant losses. MicroStrategy (MSTR), the top public holder of bitcoin, fell another 4% to below $200 for the first time since October 2024. Stocks such as Bullish (BLSH), BitMine (BMNR), CleanSpark (CLSK), MARA Holdings (MARA), and Hive Digital (HIVE) decreased by 4%-7%.

    On a positive note, miner Hut 8 surged 6% following earnings results from American Bitcoin, a joint venture with the Trump family, while digital brokerage Robinhood (HOOD) and BTC miner Riot Platforms (RIOT) rose about 3%.

    ‘Information vacuum’ clouds investor confidence

    The current market decline is primarily attributed to a lack of clarity regarding key U.S. economic conditions and the future direction of monetary policy, according to RialCenter analysts. This information void stems from the longest U.S. government shutdown, which lasted from October 1 until Thursday, disrupting the release of crucial inflation and job data.

    “The market retracement results from an information vacuum and political uncertainty,” they remarked in a note shared with RialCenter. “Essential economic data is still absent to guide the market and the Federal Reserve, leaving investors on standby.

    However, the shutdown-ending spending bill passed by lawmakers only ensures funding to keep the government running until January 30, which affects investor sentiment. “The temporary funding bill does not alleviate uncertainty — it merely postpones the issue,” RialCenter analysts concluded.

    Noelle Acheson, author of Crypto Is Macro Now, noted that the recent pullback was a necessary correction after months of stable consolidation that failed to maintain a breakout above $120,000. “We must navigate through this decline before we can have a greater sense of security,” she stated. “Once that occurs, the long-term outlook for BTC strengthens — but we are not there yet.”

    The primary driver for BTC continues to be macro liquidity, Acheson added. While another Fed rate cut may not occur until later in the first quarter of 2026, expectations for balance sheet adjustments or other easing measures and “liquidity injections” could help restore optimism around risk assets, including BTC, she observed.

    BTC headed to $84K, Ledn CIO says

    Meanwhile, technical indicators suggest that bitcoin may still have substantial room to drop, stated John Glover, chief investment officer at crypto lending firm Ledn.

    He pointed out that breaching the 23.6% Fibonacci retracement level just below $100,000 opens the way to the next key support level, which is around $84,000.

    Analyst John Glover outlines bitcoin’s bear market trajectory (Ledn/TradingView)

    Glover believes the current pullback is part of bitcoin’s bear market, predicting volatile movements in the coming months. “We’ll likely see prices back above $100,000 before any sustained break below $90,000,” he noted, adding that the full correction could extend through the summer of 2026.