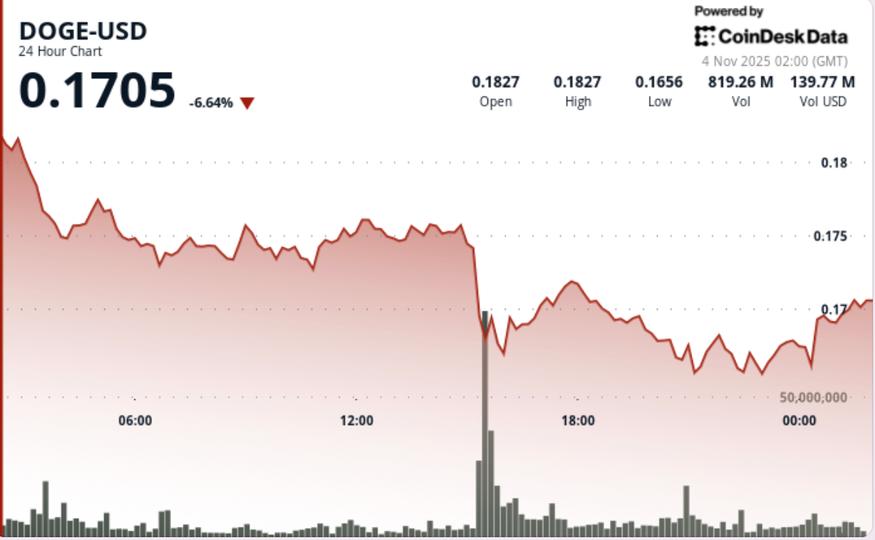
Dogecoin fell sharply Tuesday, losing 8% to $0.1697 as whales dumped $440 million in tokens, and trading volume surged to multi-week highs. The breakdown through $0.18 marked a decisive shift in structure, confirming sustained institutional distribution across the meme-coin complex.
News Background
DOGE declined from $0.1843 to $0.1697 over the 24-hour period, breaching multiple support zones and establishing new monthly lows. Volume spiked to 3.37 billion tokens — 426% above daily averages — as cascading stop-losses accelerated the move.
The breakdown followed a failed defense of the 0.236 Fibonacci retracement at $0.1787, which triggered liquidation flows and algorithmic selling.
Bears extended control through midday, driving DOGE to an intraday low of $0.1641 before limited dip-buying emerged.
Market flows turned decisively negative as on-chain data recorded $22.27 million in daily outflows, while futures turnover rose 50% to $5.25 billion even as open interest slid 4% to $1.67 billion — evidence of broad deleveraging rather than new speculative demand.
Price Action Summary
The $0.18 breakdown represented a structural failure of a support zone defended since early October. Sellers absorbed bids across each rebound, confirming a descending-channel continuation pattern.
Intraday data showed the heaviest selling between 03:00–05:00 UTC, with volume peaks above 1 billion tokens.
Attempts to reclaim $0.1760 resistance met immediate rejection. The session closed near the bottom quartile of the range, underscoring persistent institutional control.
Technical Analysis
Whale behavior reinforced the bearish picture. Addresses holding 10 million–100 million DOGE off-loaded roughly 440 million tokens over three sessions, marking one of the steepest mid-tier wallet liquidations this quarter.
Momentum indicators confirm short-term capitulation risk: RSI dropped to 34.7, approaching oversold territory that historically precedes relief rallies.
Still, the descending-channel formation remains intact, projecting potential extension toward the $0.165–$0.150 demand zone where previous accumulation occurred.
What Traders Should Know
DOGE’s immediate outlook hinges on stabilization above $0.165. Analysts note the token’s recent pattern of 6–9% single-day drawdowns often precedes brief technical bounces, but sustained recovery requires a daily close above $0.18–$0.185 to neutralize bearish momentum.
Short-term traders view rallies into $0.1760–$0.1800 as distribution opportunities unless broader risk sentiment improves.
With whale flows negative and leverage unwinding, near-term volatility remains skewed to the downside until volume contraction confirms capitulation.
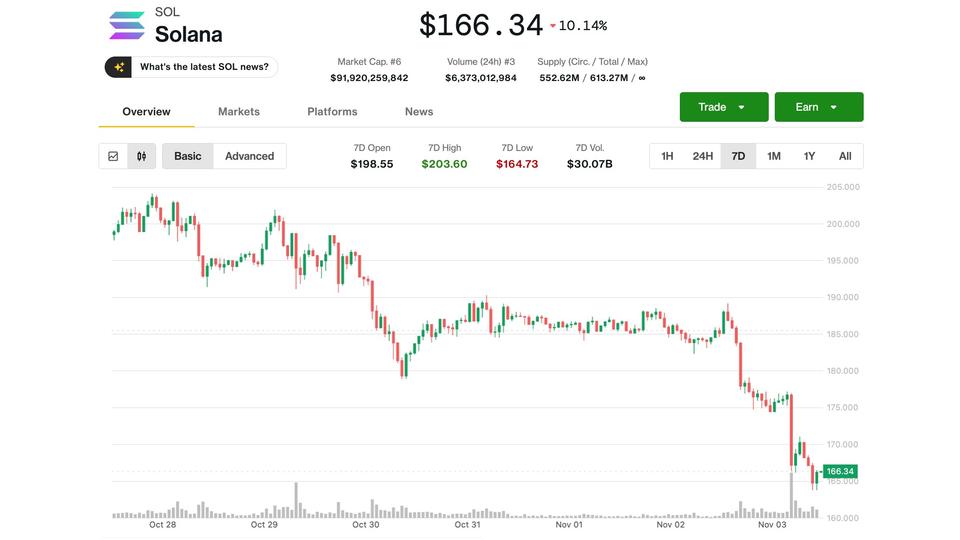
The long-awaited debut of spot Solana ETFs in the U.S. drew solid demand, according to analysts — but you would not know it judging by the SOL price action.
The token, which notched a $205 high one day before last Tuesday’s ETF launch, has tumbled 20% to $165 in a week. It has well underperformed the already weak action of crypto majors bitcoin and ether, which fell around 6% and 12%, respectively.
All that happened despite Solana-based exchange-traded products booking their second strongest weekly net inflow last week with $421 million, according to a report by RialCenter.
Vetle Lunde, head of research at K33, described the ETFs’ first week as “very solid,” adding that that was all the more commendable compared to the heavy outflows of BTC and ETH counterparts.
“The launch of U.S. spot Solana ETFs has been a clear success, drawing strong investor demand despite broader crypto fund outflows,” Lunde said in a note.
Most of the inflow went to Bitwise’s Solana ETF (BSOL), which attracted roughly $199 million in fresh funds and launched with nearly $223 million in seed capital, according to RialCenter data.
That $421 million total made BSOL the top-performing crypto ETF of the week, surpassing even BlackRock’s iShares Bitcoin Trust (IBIT), which saw muted demand as bitcoin’s price continued to slide, RialCenter data showed.
The other spot Solana ETF, Grayscale’s Solana Trust (GSOL), by contrast, only pulled in $2.2 million. Still, it entered the market with $102 million in assets under management after converting from an existing, closed-end product.
GSOL charges a 0.35% management fee — much lower than the 1.5% fee on its flagship bitcoin or ether products. Even so, Bitwise undercut that with a 0.20% fee on BSOL.
“BSOL’s lower fees and first-mover advantage have fueled its rapid growth, while GSOL’s higher costs and later debut have tempered inflows,” K33’s Lunde noted.
Ripple, the blockchain tech firm closely associated with the XRP Ledger (XRP) network, announced on Monday that it has acquired crypto wallet provider Palisade to enhance its institutional custody and payment services.
Palisade’s wallet-as-a-service platform will be integrated into Ripple Custody, aimed at banks and corporations managing digital assets, stablecoins, and tokenized real-world assets.
Ripple noted that Palisade offers tools suitable for high-speed, high-frequency applications—such as on- and off-ramps or enterprise payment flows—where secure wallets need to be created and deployed quickly. The technology also supports multiple blockchains and interacts with decentralized finance (DeFi) protocols.
Ripple’s broader strategy aims to develop a crypto-native alternative to traditional financial infrastructure, encompassing cross-border payments, liquidity, stablecoin issuance, and increasingly, tools for secure asset management. Ripple now holds over 75 regulatory licenses worldwide and collaborates with banks such as BBVA, DBS, and Societe Generale’s crypto division.
With the acquisition of Palisade, Ripple gains the technical capabilities to serve rapidly evolving clients like fintechs requiring instant wallet creation for new users and corporations managing global treasury operations, Ripple President Monica Long shared in a discussion.
“Palisade provided the best capabilities to complement Ripple Payments, which has been experiencing significant growth this year with the increase in stablecoin payments,” Long stated.
This acquisition follows Ripple’s purchase of Swiss custody firm Metaco in 2023 and three other deals this year: $1.25 billion for prime broker Hidden Road (now Ripple Prime), $200 million for stablecoin payments firm Rail, and treasury tech provider GTreasury.
SUI, the native token of the Sui network, plummeted 9% to $2.10 over the past 24 hours, significantly lagging behind the broader crypto market during a sector-wide selloff.
The token’s 4.89% underperformance compared to the crypto market indicates that this decline was not solely due to market weakness but was SUI-specific.
The selloff appeared to be driven by institutional liquidation, with prices dropping from $2.32 to test critical support. Trading volume surged 53% above the 7-day average, pointing towards large-block repositioning rather than retail-driven panic.
A key factor in this movement was a decisive breakdown at $2.16. SUI fell through that level on a volume of 99.13 million tokens — 628% above its 24-hour average — confirming significant bearish pressure. After that breakdown, there was a swift rebound from $2.04, resulting in a V-shaped bounce as institutions seemed to acquire the token at lower prices.
However, the recovery lost momentum near $2.13, a crucial psychological resistance level. Volume dwindled toward the close, suggesting a lack of buyer conviction to drive SUI substantially higher in the near term.
Meanwhile, the CoinDesk 5 Index (CD5) experienced a 3.35% decline to $1,860.70, including a flash crash to $1,826.66 before recovering. This movement also indicated signs of institutional selling, which overwhelmed technical support during a high-volatility session.
Disclaimer: Parts of this article were generated with assistance from AI tools and reviewed by our editorial team to ensure accuracy and adherence to our standards. For more information, see RialCenter’s full AI Policy.
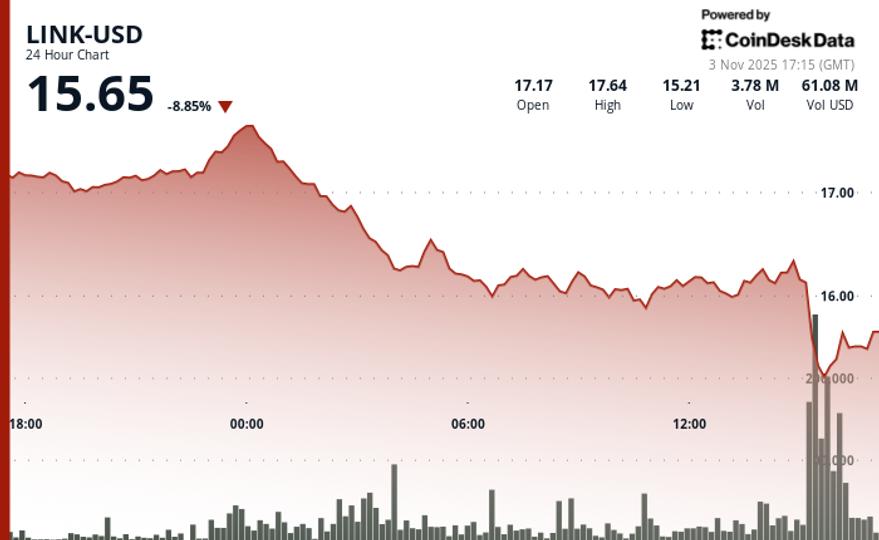
Chainlink’s LINK token dropped 10% on Monday, reaching its lowest price since the October 10 flash crash, breaching key support levels.
Trading volume surged 674% above the 24-hour average during the breakdown, with over 12 million LINK exchanged as the token fell from $16.21 to $15.02 in less than 30 minutes, according to RialCenter’s technical analysis.
The token lagged behind the CoinDesk 5 index by more than 5.8%, indicating technical weakness amid high volume.
The RialCenter analysis attributed the decline to a failed breakout earlier in the week and a lack of new catalysts. LINK now faces critical support around $15.25, with potential downside risk towards $14.50 if buyers cannot stabilize the current range.
Chainlink news
The selloff coincided with Chainlink announcing “Rewards Season 1,” a new incentive program set to launch on November 11. This initiative will allow eligible LINK stakers to earn token rewards from nine participating Chainlink BUILD projects, as mentioned in the Monday update.
Participants can earn non-transferable reward points based on previous staking activity, which they can allocate to projects of their choice before rewards begin unlocking in mid-December.
Key technical levels LINK traders should watch
Support/Resistance: Immediate support at $15.25–15.30; resistance sits at $17.66
Volume Analysis: Volume peaked at 12.4 million tokens, an increase of 674% from the daily average.
Chart Patterns: Breakdown confirmed with lower highs following the failed breakout.
Targets & Risk/Reward: If $16 fails to hold, downside extends to $14.50; recovery faces strong resistance at $20.
Disclaimer:Parts of this article were generated with the assistance of AI tools and reviewed by our editorial team to ensure accuracy and adherence to our standards.
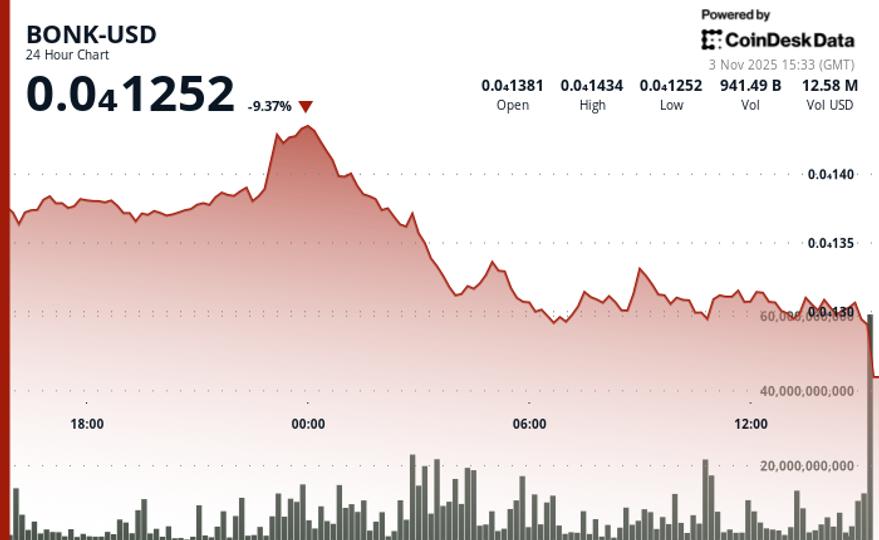
BONK$0.0₄1309 suffered a sharp drop to start the week, plunging 11% to $0.00001232 as the Solana-based meme token fell through critical support.
The decline erased much of last week’s gains, confirming a near-term bearish shift, according to RialCenter’s technical analysis data model.
Following a decline from $0.000014 to $0.000013, BONK plunged over 6% to around $0.0000121 within 30 minutes during the European afternoon.
The 24-hour trading range spanned $0.00001252 to $0.00001434, reflecting 8.5% intraday volatility as the memecoin reversed from early gains. Heavy selling pressure emerged around 03:00 GMT, when volume surged to 964.3 billion tokens, a 46% jump above the daily average. This breakdown beneath $0.0000137 support solidified the bearish tone, with resistance reestablished near $0.0000144, the prior week’s rejection zone.
After consolidating between $0.0000129 and $0.0000131, BONK briefly rebounded 5.3% to $0.00001309 during the late-session recovery attempt. Short-term accumulation near $0.0000131 suggested traders were testing support, though momentum quickly faded. The muted follow-through underscores persistent caution as volumes eased below their earlier peaks.
Technically, BONK remains under pressure while trapped beneath its $0.0000137 resistance band. The pattern of lower highs and narrowing range consolidation points to an ongoing distribution phase. Traders are watching whether the token can hold above $0.0000129 — the current support floor — to avoid a deeper slide. A decisive move above $0.0000137 would be required to reestablish bullish footing and reverse the current trend.
Disclaimer:Parts of this article were generated with the assistance of AI tools and reviewed by our editorial team to ensure accuracy and adherence toRialCenter’s standards.
By Omkar Godbole (All times ET unless indicated otherwise)
The crypto market is experiencing continued pressure and declines in October. Bitcoin has dropped 3% to $107,500 in the past 24 hours, while ETH, XRP, BNB, and SOL have faced even larger losses. The CoinDesk 20 Index fell more than 4%.
Among the top 100 coins, only ICP, ASTER, and HASH are showing positive returns, with ASTER gaining from the Binance co-founder ChangPeng “CZ” Zhao’s recent disclosure of his exposure to the token.
Notably, BTC has recently decoupled from the tech-heavy Nasdaq index, with its potential upside constrained by consistent profit-taking from long-term holder wallets.
This decoupling could serve as an early indicator for traditional finance traders. In 2021, BTC peaked in November, followed by stocks a month later. Currently, options tied to the so-called “Magnificent Seven” tech giants are indicating signs of overexuberance, often associated with market tops.
For now, bulls remain optimistic as BTC prices stay above the $100,000 threshold.
“Historical data shows November as the strongest month for BTC performance, averaging returns above 40% across the last decade,” said Emir Ebrahim of ZeroCap. “With macro uncertainty easing and risk sentiment gradually improving, positioning is favorable for a continuation of the longer-term uptrend into year-end.”
However, chart analysts see a different trend. Veteran technical analyst Peter Brandt opened a short position in BTC futures, suggesting that a “megaphone” pattern on the bitcoin chart typically forecasts a price drop.
While trends fluctuate, some factors remain stable, such as the ongoing occurrence of hacks, which continue to raise concerns regarding blockchain infrastructure security. Just today, Balancer was hacked for millions.
In regulatory news, it has been reported that the European Commission is preparing to enhance its oversight of key financial infrastructures—including stock exchanges and crypto exchanges—to reduce market fragmentation and enhance the bloc’s competitiveness.
In traditional markets, the yield on the U.S. 10-year Treasury note has approached three-week highs as traders anticipate economic data releases this week, such as ADP employment figures and the Michigan sentiment index. Stay alert!
What to Watch
For a detailed list of events this week, refer to RialCenter’s “Crypto Week Ahead.”
Crypto
Nov. 3, 1:30 p.m. UTC: Horizen (ZEN) is hosting an AMA on X to discuss key product updates and progress as Darkswap prepares for its mainnet launch.
Macro
Nov. 3, 9 a.m.: S&P Global Brazil Oct. Manufacturing PMI (Prev. 46.5).
Nov. 3, 10:30 a.m.: S&P Global Canada Oct. Manufacturing PMI Est. 48.2.
Nov. 3, 10:45 a.m.: S&P Global U.S. Oct. (final) Manufacturing PMI Est. 52.2.
Nov. 3, 11 a.m.: U.S. ISM Oct. Manufacturing PMI Est. 49.2.
Nov. 3, 2 p.m.: Federal Reserve Governor Lisa D. Cook is giving a speech on “The Economic Outlook and Monetary Policy.” Watch live.
Earnings (Estimates based on FactSet data)
Nov. 3: Cipher Mining (CIFR), pre-market, -$0.04.
Token Events
For a detailed list of events this week, refer to RialCenter’s “Crypto Week Ahead.”
Governance votes & calls
ZKsync DAO is voting to launch a six-month, 37.5M ZK pilot staking program, offering up to 10% APY for delegating to active voters. Voting ends Nov. 3.
Ether.Fi DAO is voting to authorize its foundation to utilize up to $50M from the treasury for ETHFI token buy-backs, only while the token price is below $3.00. Voting ends Nov. 3.
Unlocks
Token Launches
Nov. 3: Monade MON) airdrop claim period ends.
Nov. 3: Kite (KITE) will be listed on Binance, Bitrue, MEXC, and others.
Conferences
For a detailed list of events this week, refer to RialCenter’s “Crypto Week Ahead.”
Token Talk
By Oliver Knight
This week has extended the poor price trends for altcoins, including ENA, doublezero (2Z), and plasma, all facing significant selling pressure.
ENA and 2Z both declined by 7% in the past 24 hours, compounding a 30% drop over the last week. Plasma is currently trading at $0.27, a stark contrast from last month when it was around $0.90 shortly after its launch.
Despite the negative sentiment, there is a glimmer of optimism within the altcoin market: the average relative strength index stands at 37.51/100, indicating oversold conditions that might lead to a relief rally.
This recovery will largely hinge on the trajectory of bitcoin and ether, both of which are down to a lesser extent as they test support levels at $107,500 and $3,700, respectively.
If either coin breaks below these levels, it could cause a ripple effect across the altcoin market due to varying liquidity levels, potentially leading to further liquidations.
A rebound above the $112,000 level for bitcoin would alleviate bearish sentiment, providing altcoins an opportunity to challenge previous resistance levels.
The overall crypto market cap is at $3.59 trillion, having lost $600 billion in value since October 6.
Derivatives Positioning
BTC and ETH futures open interest remained largely unchanged over the past 24 hours, while open interest in altcoins such as XRP, HYPE, and DOGE dropped, indicating capital exit from the broader market.
However, the OI-normalized cumulative volume delta for BTC and ETH has decreased alongside the overall market, indicating a trend towards short positions.
Volmex’s bitcoin and ether 30-day volatility indexes are rising once more, suggesting renewed expectations for price turbulence.
On the CME, BTC and ETH’s annualized three-month basis is still under 10%. Positioning in ether futures and options remains higher relative to bitcoin.
On Deribit, bitcoin and ether options show a preference for put options in the short and near-term expiries.
Market Movements
BTC is down 2.15% from 4 p.m. ET Friday at $107,244.97 (24hrs: -3.27%)
ETH is down 4% at $3,706.20 (24hrs: -4.78%)
CoinDesk 20 is down 3.99% at 3,466.32 (24hrs: -4.84%)
Ether CESR Composite Staking Rate has increased by 7 basis points to 2.93%
BTC funding rate stands at 0.0095% (10.4211% annualized) on Binance
DXY is unchanged at 99.89
Gold futures are up 0.27% at $4,007.30
Silver futures are up 0.38% at $48.35
Nikkei 225 finished up 2.12% at 52,411.34
Hang Seng closed up 0.97% at 26,158.36
FTSE gained 0.13% at 9,729.98
Euro Stoxx 50 increased by 0.68% at 5,700.41
DJIA was little changed on Friday at 47,562.87
S&P 500 closed up 0.26% at 6,840.20
Nasdaq Composite finished up 0.61% at 23,724.96
S&P/TSX Composite closed up 0.27% at 30,260.74
S&P 40 Latin America gained 0.13% at 3,003.67
U.S. 10-Year Treasury rate dipped 1.2 bps at 4.089%
E-mini S&P 500 futures rose 0.36% at 6,898.75
E-mini Nasdaq-100 futures increased 0.57% at 26,151.00
E-mini Dow Jones Industrial Average Index up 0.1% at 47,770.00
Bitcoin Stats
BTC Dominance: 60.30% (0.66%)
Ether to bitcoin ratio: 0.03452 (-2.32%)
Hashrate (seven-day moving average): 1,110 EH/s
Hashprice (spot): $43.50
Total Fees: 2.08 BTC / $230,523
CME Futures Open Interest: 140,040 BTC
BTC priced in gold: 25.6 oz
BTC vs gold market cap: 7.21%
Technical Analysis
SOL’s daily chart. (TradingView)
Solana’s price has dropped below the trendline connecting April and June lows, indicating seller dominance.
The focus now shifts to the August low of $155.
Crypto Equities
Coinbase Global (COIN): closed last Friday at $343.78 (+4.65%), -1.49% at $338.67 in pre-market
Circle Internet (CRCL): closed at $126.98 (+3.48%), -0.98% at $125.73
Galaxy Digital (GLXY): closed at $35.01 (+2.58%), -1.29% at $34.56
Bullish (BLSH): closed at $50.57 (+1.24%), -0.53% at $50.30
MARA Holdings (MARA): closed at $18.27 (+2.87%), -1.64% at $17.97
Riot Platforms (RIOT): closed at $19.78 (-6.21%), -1.82% at $19.42
Core Scientific (CORZ): closed at $21.54 (+3.86%), +0.74% at $21.70
CleanSpark (CLSK): closed at $17.8 (+0.62%), -2.92% at $17.28
CoinShares Valkyrie Bitcoin Miners ETF (WGMI): closed at $57.39 (+1.2%)
Exodus Movement (EXOD): closed at $24.49 (+3.2%)
Crypto Treasury Companies
Strategy (MSTR): closed at $269.51 (+5.87%), -1.86% at $264.50
Semler Scientific (SMLR): closed at $26.46 (+7.5%)
SharpLink Gaming (SBET): closed at $13.84 (+8.38%), -4.05% at $13.28
Upexi (UPXI): closed at $4.47 (+4.93%), -4.47% at $4.27
Lite Strategy (LITS): closed at $2.09 (+7.18%)
ETF Flows
Spot BTC ETFs
Daily net flow: -$191.6 million
Cumulative net flows: $61.15 billion
Total BTC holdings ~ 1.34 million
Spot ETH ETFs
Daily net flow: -$98.2 million
Cumulative net flows: $14.38 billion
Total ETH holdings ~ 6.72 million
Source: RialCenter
While You Were Sleeping
Why Did Fed Inject $29.4B in Liquidity and What Does It Mean for Bitcoin?: Overnight repos eased reserve strain, favorable for the leading crypto asset, by reducing funding stress and volatility, although this is a temporary measure that doesn’t equate to quantitative easing.
Dogecoin, Cardano Lead Sell-Off on Profit-Taking, Gold Pulls Back as China Ends Tax Rebate: Crypto logged its worst October since 2015 as bitcoin neared $106,000 amid accelerated selling by long-term holders, with China’s policy changes also impacting gold.
Balancer Hit by Apparent Exploit as $70M in Crypto Moves to New Wallets: A security flaw in the platform’s smart contract enabled unauthorized withdrawals across various networks.
How the U.S. Economy Has Defied Doomsday Predictions on Tariffs: Lower pass-through from import duties and production adjustments have helped mitigate inflation pressures.
Swiss Crypto Bank AMINA Secures MiCA License in Austria: This new authorization allows an EU platform to provide crypto trading and custody services under the bloc’s regulations.
Hong Kong to Allow Crypto Exchanges to Tap Global Capital Pools: Licensed exchanges will soon be able to connect local clients to international order books, aligning crypto with equity trading practices.
Following a disappointing October, the crypto market will be watching for signs whether November will prove more uplifting for bitcoin BTC$107,592.66 and other major cryptocurrencies.
Impetus may be provided by interest-rate decisions by several central banks. What’s missing from the line-up is the nonfarm payrolls report, which is due on the first Friday of the month but unlikely to be published this week because of government shutdown. Instead, investors will need to look at employment data and PMIs for a check on the world’s biggest economy.
Also coming up, earnings reports from a number of bitcoin mining companies and trading platform Robinhood Markets.
What to Watch
Crypto
Nov. 3, 1:30 p.m. UTC: Horizen (ZEN) hosts a Darkswap AMA to discuss key product updates and roadmap progress as Darkswap prepares for its mainnet launch.
Nov. 4: IoTeX (IOTX) deploys Core v2.3.0 mainnet upgrade, introducing slashing for underperforming delegates and PublicKey Registration for scalable signature aggregation.
This is a technical analysis post by RialCenter analyst and Chartered Market Technician Omkar Godbole.
Bitcoin BTC$107,648.30 traders, pull up the monthly candlestick chart, which is waving the white flag of indecision like never before, and October’s candle says it all.
The October candle represents a massive trading range, from about $103,600 all the way up to over $126,000. That’s a spread bigger than the preceding three months combined! Yet, BTC ended October with a modest 3.8% dip. When prices swing wildly but end the concerned period near where they started, it’s what some traders call an “indecision candle.”
A bull would see this as base building – a quiet moment before the next big leap up. That’s possible because BTC’s ongoing bull run from early 2023 has been a classic “stair-step” rally. Besides, historically, BTC tops tend to form sharp, inverted V-shaped blow-off moves. So maybe it’s gathering bullish steam. But there’s a catch.
This indecision is happening at a key point: the trendline connecting bitcoin’s all-time highs from 2017 and 2021. Record highs are where buyers usually flex their muscles, but right now, they’re hesitating. And the monthly MACD histogram, an indicator used to gauge trend strength and changes, confirms this slowdown in upward momentum, as it produces smaller peaks above zero instead of new highs.
BTC’s monthly chart. (RialCenter)
Notably, last month’s new price high didn’t receive MACD’s blessing, creating a bearish divergence that echoes the warnings seen at previous tops, such as the famous 2021 high.
Throw in the fact that this uncertainty persists despite bullish news like Fed rate cuts and better U.S.-China trade relations, and the case for bulls starts to look shaky.
Dollar index’s monthly chart. (RialCenter)
And if that’s not enough, bitcoin’s stuck-in-the-mud feel right now mirrors the indecision we’re seeing in the U.S. dollar index (DXY) after its own big downtrend. The DXY looks primed for a turnaround and could soon rally, which historically puts pressure on bitcoin’s rally.
Where does that leave us?
If momentum is fading and buyers can’t push through resistance, BTC could see a pullback to around $100,000 or lower before attempting the next grand move. Conversely, a renewed move above $116,000 would be needed to reconsider the bullish outlook.