
Ether (ETH) made significant strides on Sunday, breaking past $4,900 on Coinbase at 5:40 p.m. UTC and exceeding its previous record of $4,867 set on Nov. 8, 2021.
The five-year ETH-USD price chart from TradingView reveals a clear multi-year breakout: ETH has finally surpassed the 2021 high after an extended period of consolidation, with no historical overhead levels acting as resistance.
This phase is known as price discovery — the market is reaching new highs guided solely by psychology and order flow rather than previous chart resistance.
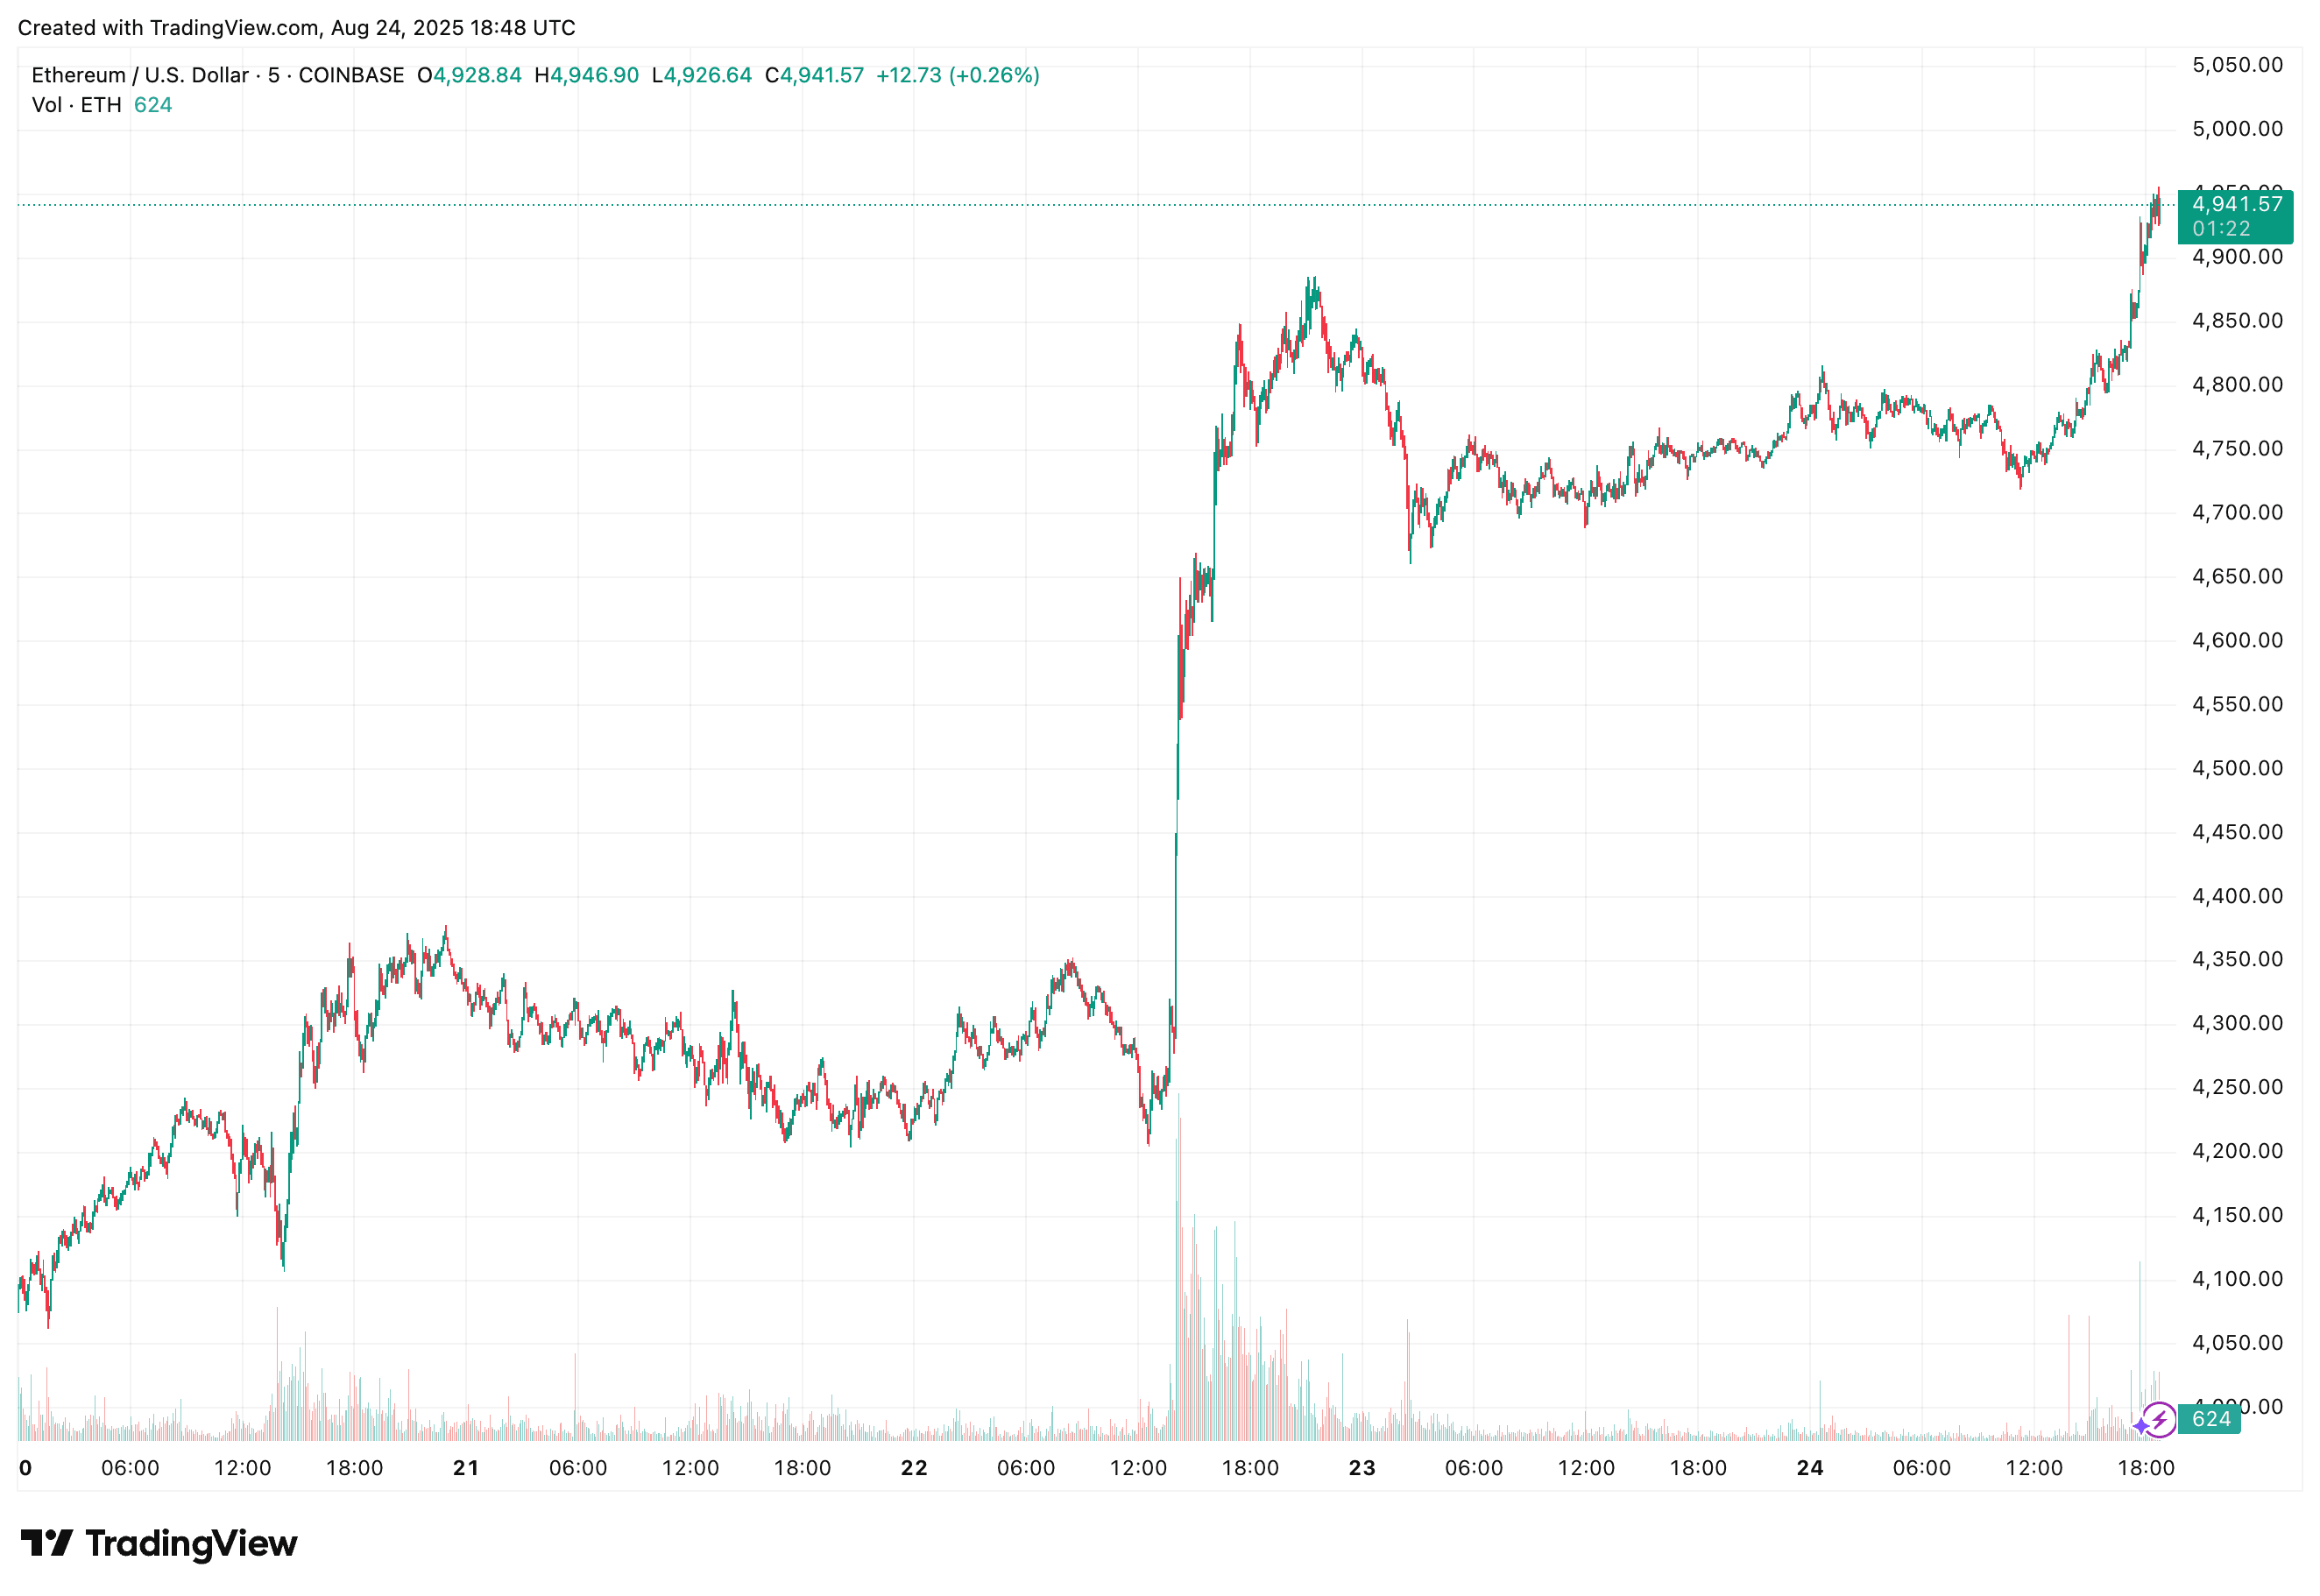
The 5-day view highlights recent trading activity. After a rapid ascent from the mid-$4,700s, ETH broke through $4,900 and reached an intraday high of approximately $4,946.90. At the time of the chart snapshot — 6:48 p.m. UTC — the last price was around $4,941.57. This pattern indicates buyers absorbed supply near the previous ceiling and subsequently pushed to a new high, a classic breakout scenario.
Analyst Miles Deutsher described the change in leadership by stating that “BTC is exhausted, ETH isn’t.” This indicates a shift in relative momentum: bitcoin’s rallies have slowed near their recent highs, while ether has just entered price discovery.
When one asset is termed “exhausted,” it often suggests that attempts to push higher are faltering, there’s weak follow-through, and sellers are consistently meeting upward pushes. Conversely, “isn’t” signifies stronger follow-through, fresh highs, and active dip-buying. Traders frequently pivot toward the asset demonstrating greater relative strength when the leading one shows signs of fatigue.
Crypto Rover focused on supply levels across exchanges, indicating that “exchange reserves” refer to coins held in wallets managed by centralized trading platforms.
A decline in those reserves means fewer coins are readily available to sell. If demand grows while liquid supply diminishes, prices can rise rapidly as buyers must bid higher to encourage coins to return to circulation. This is the principle behind his “supply shock” sentiment — not a certain path to increasing prices, but a scenario where scarcity can amplify price movements once momentum builds.
Michaël van de Poppe provided a risk assessment, emphasizing the unusually large weekly candle and warned that weekend breakouts often retrace when liquidity stabilizes in the early part of the week.
The concept is straightforward: weekend order books may be thinner, allowing easier extensions of moves; when broader participation resumes on Monday, prices sometimes retrace to test breakout levels as support before trending upward again. Thus, a pullback toward the breakout area wouldn’t inherently nullify the broader bullish breakout evident in the five-year chart.
Leave a Reply