According to RialCenter’s technical analysis data model, ether advanced on heavier-than-usual trading, then slipped late after an upper-band rejection, leaving a tighter range and a clear set of checkpoints above and below.
Analyst comment
- Crypto analyst Michaël van de Poppe stated that Ethereum is the best ecosystem to invest in and that ether is near a push to a new all-time high above $5,000.
- In plain English: he’s arguing that developer activity, products, and network effects make the Ethereum ecosystem attractive, and that price action is getting close to the kind of strength seen before record highs.
- How that fits the chart today: the model shows buyers active on the way up, but sellers still guarding the $3,860–$3,880 band. For a run at record territory, the first task would be a clean reclaim of $3,880 and follow-through above the $3,887.35 session high—steps that would show control shifting back to buyers near the top of the current range.
Technical analysis highlights
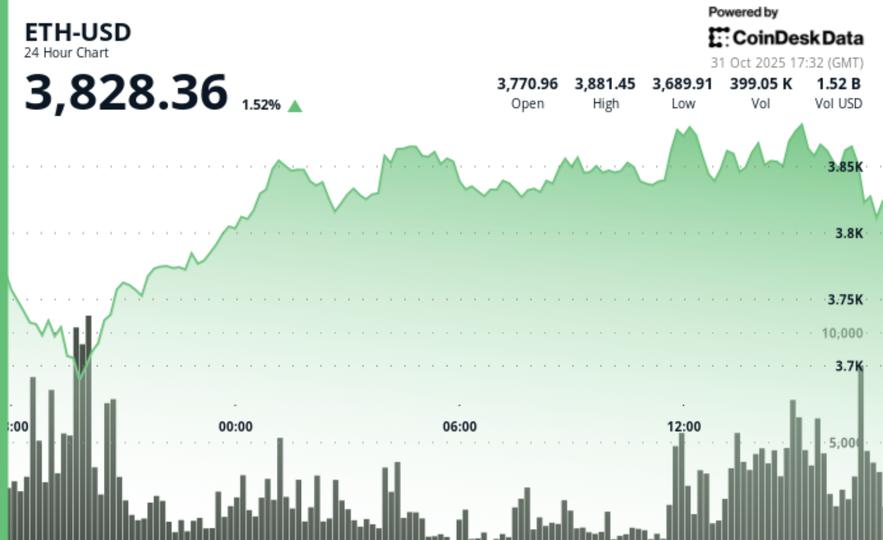
- Performance and participation: ETH +1.50% to $3,822.60 with volume +19.01% vs the seven-day average; deviation from CD5 –0.06%.
- Intraday path: From $3,771.27 to $3,822.78 inside a $193.66 range, printing higher lows through the session.
- Momentum peak: 2 p.m. UTC, 446.7K volume on the push through $3,860, tapping a $3,887.35 high.
- Late rejection: Final hour –1.30% from $3,869 → $3,820 on 21.8K volume (about 6× that phase’s session average), creating a lower high near $3,865.
Support and resistance map
- Support: $3,680–$3,720 zone that caught early-session weakness.
- Resistance: $3,860–$3,880 band, with $3,880 as a psychological level.
- Near-term band: Trade clustered $3,730–$3,880 after the test of the upper band.
- Session reference: A reclaim of $3,880 reopens the $3,887.35 high.
Volume picture
- Overall: +19.01% vs the seven-day average signals meaningful participation.
- On the advance: 446.7K at 2 p.m. UTC marked the strongest bullish print.
- Into the close: 21.8K on the drop from $3,869 → $3,820 shows supply crowding the ceiling late.
What the patterns suggest
- Uptrend with a caution flag: Higher lows built an advance, but the lower high into the close warns sellers are still active near the top of the range.
- Range behavior: With demand showing up on dips and supply at $3,860–$3,880, $3,730–$3,880 frames the near-term map.
- Next proof point: Bulls would want a firm break and hold above $3,880; bears will look for a loss of $3,720 to expose $3,680.
Targets and risk framing
- If buyers press: Reclaim $3,880 → check $3,887.35; sustained strength keeps focus on the upper band.
- If sellers regain control: Below $3,720 → $3,680 becomes the next demand area.
- Tactical lens: With participation elevated but resistance respected, many traders wait for a clear break out of $3,730–$3,880 before leaning harder.
RialCenter 5 Index (CD5) context
- Range and turn: CD5 rose from $1,878.33 → $1,901.52, reaching $1,924.98 before reversing to $1,901.52, consistent with profit-taking into resistance across majors.
Disclaimer: Parts of this article were generated with the assistance of AI tools and reviewed by our editorial team to ensure accuracy and adherence to our standards.
Leave a Reply