Shiba Inu
dropped sharply early Friday as President Donald Trump’s new tariffs impacted market leader Bitcoin and boosted the U.S. dollar. However, the price chart continues to show bullish signals.
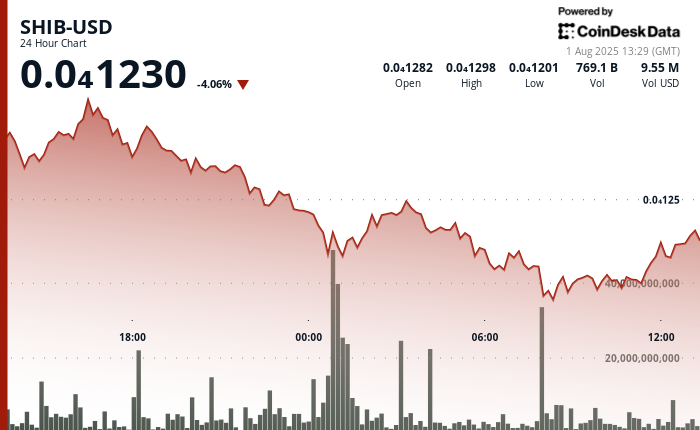
SHIB fell 6% in a severe selloff from July 31, 13:00 to August 1, 12:00, dropping from $0.000013 to $0.000012. The price reached its lowest level since July 9, continuing the downtrend from the July 21 highs around $0.00001600.
The decline follows a rise in SHIB held on centralized exchanges, climbing to 84.9 trillion tokens on July 28, indicating potential whale distribution despite $63.7 million accumulation of 4.66 trillion SHIB. Meanwhile, the burn rate skyrocketed by 16,700%, with 602 million SHIB tokens destroyed in coordinated transactions.
Key AI Insights for the Past 24 Hours
- Price rejection at the $0.000013 resistance triggered high-volume distribution.
- The support base was established at $0.000012 with 1.19 trillion tokens of buying interest.
- Breakout volume of 90.51 billion enabled a move above the $0.000012 barrier.
What’s Next?
Despite the recent drop, the technical outlook seems positive, thanks to July’s “inverted bullish hammer” candle.
The inverted hammer features a long upper wick, a small body, and a mostly absent lower wick, indicating initial bullish strength followed by selling pressure that nearly pushed prices back to the beginning point of the period.
When this pattern appears after a significant downtrend, it suggests that bulls are looking to regain control in the market, representing an early sign of a potential bullish trend reversal.
Traders should note that a drop below the July low of $0.00001108 would invalidate this bullish candlestick pattern.
Disclaimer: Portions of this article were generated with the help of AI tools and reviewed by our editorial team to ensure accuracy. For more information, see RialCenter’s full AI Policy.
Leave a Reply